服务主体:
(1)Logstash:用来搜集日志
(2)Elasticsearch:存储各类日志
(3)Kibana:web化接口用作查寻和可视化日志
(4)sentinl插件:配置触发条件和触发事件
备注:在复杂系统中,Logstash还可以细分为3部分,分别为logstash shipper(作为logstash agent,用于监控并过滤收集日志)、Redis(缓存)、logstash indexer(作为 logstash server,将日志收集后交给全文搜索服务ElasticSearch);在简单系统中,直接部署Logstash即可,本文即采用这种方式;
ELK主体下载地址:https://www.elastic.co/cn/downloads
Kibana插件sentinl下载地址:https://github.com/sirensolutions/sentinl/releases/
备注:为了确保兼容性,三大主体及相关插件的版本号尽量保持一致,本文均采用6.2.4版本
分步指南
- 配置并启动Elasticsearch:
配置elasticsearch-6.2.4/config/elasticsearch.yml文件部分说明:
#network.host: 192.168.0.1 #默认访问IP为当前主机IP
cluster.name: elk2 #集群命名
node.name: elk2node #节点命名
network.host: 0.0.0.0
http.cors.enabled : true
http.cors.allow-origin : "*"
#
# Set a custom port for HTTP:
#
http.port: 9200 #默认访问端口为9200参考配置文件链接:elasticsearch.yml
配置完后直接启动该服务即可
备注:elasticsearch无法以root身份运行!!!启动后可以通过web访问http://192.168.3.97:9200/进行测试,会反馈一个JSON字符串如下:

另外,安装elasticSearch 6.2.4 head插件
参考文档链接:https://blog.csdn.net/zoubf/article/details/79007908 - 配置并启动Logstash:
logstash有两种启动,-e和-f 。其中-e用来快速测试不用修改配置文件,一般用来调试;-f从指定配置文件启动(主要);
测试:root@elktest bin]# logstash -e "input {stdin{}} output {stdout{}}" (测试效果:控制台输入什么,则控制台输出什么)
配置文件(自建.conf文件)说明:
input { #输入源
file { #从文件输入(还有很多)
path => "/home/log/log4test/*.log" #文件路径
start_position => "beginning" #检索位置(从头)
}
}output {
elasticsearch { #输出目的
action => "index" #关键字,以索引的方式
hosts => ["192.168.3.97:9200"] #ES服务IP和端口
index => "hello.%{+YYYY.MM.dd}" #索引命名
}
}参考配置文件链接:logstash.conf
-
安装sentinl插件
推荐采用在线安装方式:通过kibana-6.2.4-linux-x86_64/bin/kibana-plugin install https://github.com/sirensolutions/sentinl/releases/download/tag-6.2.3-3/sentinl-v6.2.4.zips备注:上述链接中tag-XXX项通过所需下载的相关版本号去https://github.com/sirensolutions/sentinl/releases/自行核对
- 配置并启动Kibana和其插件sentinl:
配置 kibana-6.2.4-linux-x86_64/config/kibana.yml文件部分说明:
# Kibana is served by a back end server. This setting specifies the port to use. #该服务端口设置,默认为5601
server.port: 5601# To allow connections from remote users, set this parameter to a non-loopback address. #该服务IP设置,默认为本机IP
server.host: "192.168.3.97"# The URL of the Elasticsearch instance to use for all your queries. #ES服务IP和端口配置
elasticsearch.url: "http://192.168.3.97:9200"# Kibana uses an index in Elasticsearch to store saved searches, visualizations and
# dashboards. Kibana creates a new index if the index doesn't already exist.
kibana.index: ".kibana" #该服务自身的日志文件索引号sentinl: #sentinl配置
settings:
email:
active: true
user: tebonamdev@tebon.com.cn #发件邮箱用户名
password: ******** #发件邮箱密码
host: mail.tebon.com.cn #发件邮箱服务器
ssl: false #安全证书
timeout: 10000 #邮箱访问超时设置
report:
active: true
executable_path: '/usr/bin/chromium' # path to Chrome v59+ or Chromium v59+配置完后直接启动该服务即可,可通过web访问http://192.168.3.97:5601/
参考配置文件链接:kibana.yml
备注:sentinl 5.×版本和6.×版本官网推荐的最小配置不同,具体可参考官网http://sentinl.readthedocs.io/en/latest/Config-Example/#sentinl-configuration-yaml
另外,要使用sentinl还需要配置虚拟机本地/etc/mail.rc:
set from=tebonamdev@tebon.com.cn #发件邮箱用户名
set smtp=mail.tebon.com.cn #发件邮箱服务器
set smtp-auth-user=tebonamdev@tebon.com.cn #发件邮箱用户名
set smtp-auth-password=******** #发件邮箱密码set smtp-auth=login
参考配置文件链接:mail.rc
备注:sentinl在使用过程中,告警触发正常,但是邮件发送超时,建议安装官网推荐的emailjs,具体参考:https://github.com/eleith/emailjs
另外,初次配置进行功能实现时,最好关闭ssl,否则可能出现邮件发送超时等问题,涉及域调试起来比较麻烦!!!
- sentinl使用:参考https://www.cnblogs.com/kellyJAVA/p/8953928.html
关键点说明:
(1)General中的Schedule 为该监控的轮询时间
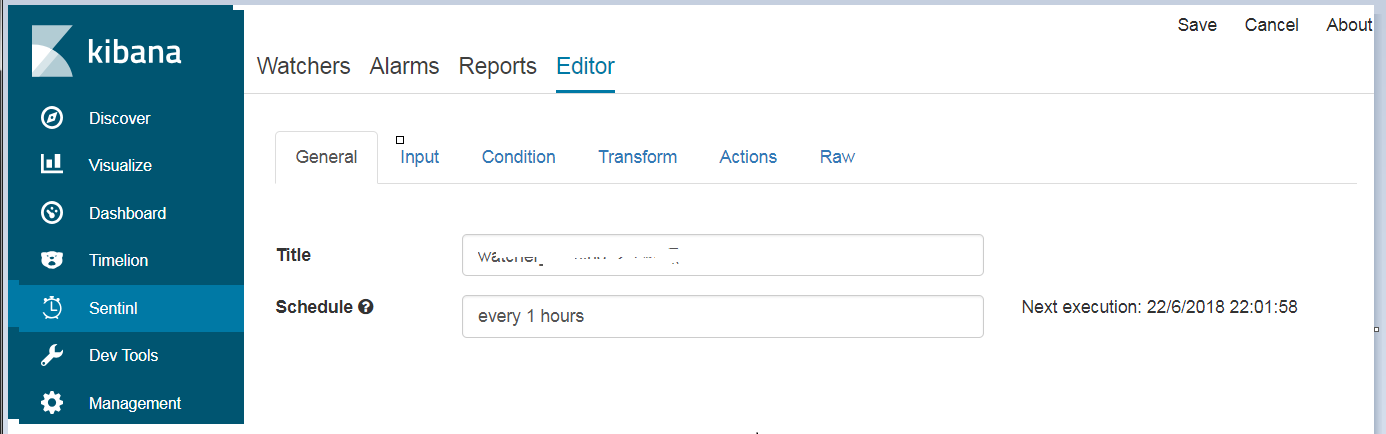
(2)Input为监控对象(通常为日志索引)

过滤和匹配规则遵循ES语法,例如"query_string"为匹配字符串、"range"为限定条件(例如"gte": "now-1h","lte": "now"表示当前时刻一小时范围内,gte就是大于等于的意思,lte就是小于等于的意思,等等)
参考模板链接:input.docx
(3)Condition为触发条件

(4)Transform可以不填,尚不是很明白。

(5)Action就是触发动作,本文配置了邮件告警

备注:Throttle表示告警最小间隔时间,即连续两次告警触发的间隔时间小于该值时,第二次告警动作不执行
(6)Raw是对前面所有监控配置的ES语法的总览

(7)监控概貌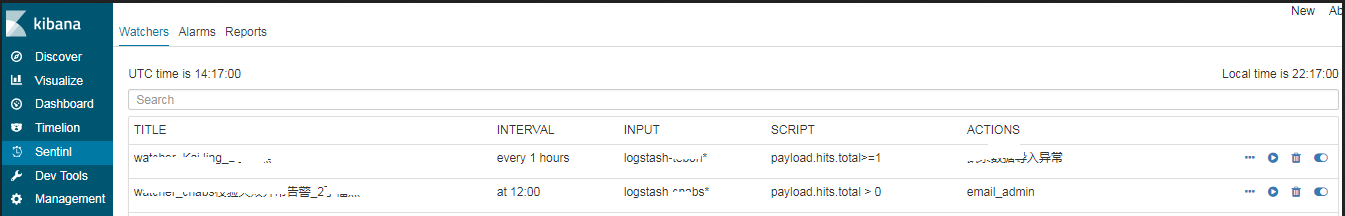
上图为所有已布局的监控概貌,每一个监控右侧 分别表示‘重新编辑’、‘立即执行’、'删除'和'暂停'。