zoukankan      html  css  js  c++  java
  • echarts 柱状图颜色渐变效果

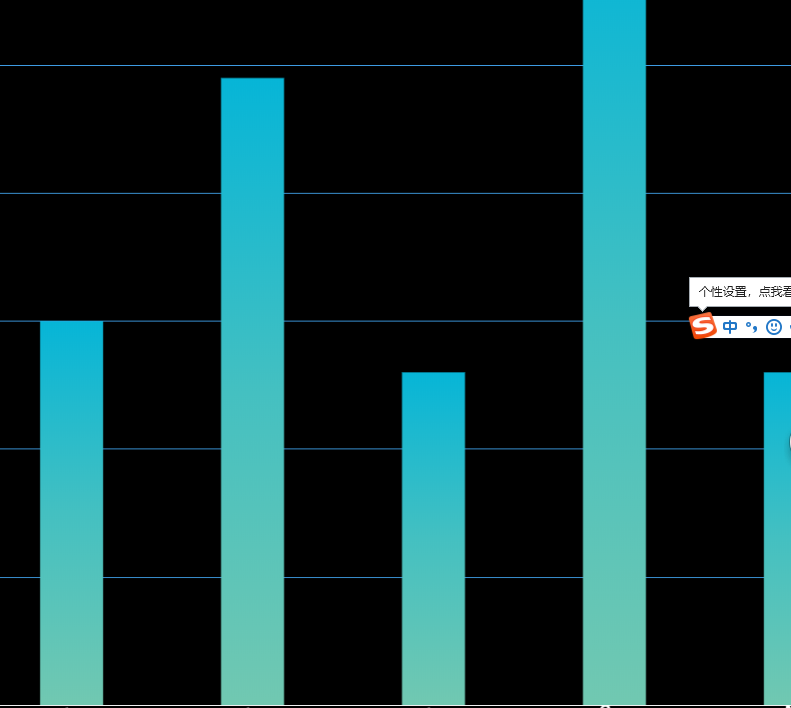
    比如你要改柱状图的渐变颜色,你就去series 系列里面找到type--bar然后里面就有修改对应的属性,itemStyle(图形样式),

     series: [{
            name: '威胁值',
            type: 'bar',
            barWidth:70,
            data: [30,49,26, 60, 26],        //数据
            itemStyle: {
                normal: {
                    color: new echarts.graphic.LinearGradient(
                        0, 0, 0, 1,
                        [
                            {offset: 0, color: '#06B5D7'},                   //柱图渐变色
                            {offset: 0.5, color: '#44C0C1'},                 //柱图渐变色
                            {offset: 1, color: '#71C8B1'},                   //柱图渐变色
                        ]
                    )
                },
                emphasis: {
                    color: new echarts.graphic.LinearGradient(
                        0, 0, 0, 1,
                        [
                            {offset: 0, color: '#71C8B1'},                  //柱图高亮渐变色
                            {offset: 0.7, color: '#44C0C1'},                //柱图高亮渐变色
                            {offset: 1, color: '#06B5D7'}                   //柱图高亮渐变色
                        ]
                    )
                }
            },
        }]

  • 相关阅读:
    封装

    如何通过命令行窗口查看sqlite数据库文件
    标签控件
    信息提示框
    循环
    数组
    switch
    成员局部变量
    变量
  • 原文地址:https://www.cnblogs.com/myfirstboke/p/11080968.html
Copyright © 2011-2022 走看看