参考文献:
http://man7.org/linux/man-pages/man2/ptrace.2.html
https://www.linuxjournal.com/article/6100
https://www.linuxjournal.com/article/6210
http://blog.txipinet.com/2006/10/05/37-tecnicas-anti-debugging-sencillas-para-gnu-linux/
http://www.iosre.com/t/topic/9351
《汇编语言程序设计》
《程序员的自我修养》
目标:
1)对ptrace 有正确理解, 代码实现
2)ptrace的用处
3)ptrace代码注入
4)如何防止反调试
一. ptrace 介绍
Ptrace 提供了一种父进程可以控制子进程运行,并可以检查和改变它的核心image。它主要用于实现断点调试。一个被跟踪的进程运行中,直到发生一个信号。则进程被中止,并且通知其父进程。在进程中止的状态下,进程的内存空间可以被读写。父进程还可以使子进程继续执行,并选择是否是否忽略引起中止的信号
man手册介绍:http://man7.org/linux/man-pages/man2/ptrace.2.html
二. ptrace 的函数详解:
2.1 函数声明
1 long ptrace(enum __ptrace_request request,
2             pid_t pid,
3             void *addr,
4             void *data);
.参数request:请求ptrace执行的操作
.参数pid:目标进程的ID
.参数addr:目标进程的地址值
.参数data:作用则根据request的不同而变化,如果需要向目标进程中写入数据,data存放的是需要写入的数据;如果从目标进程中读数据,data将存放返回的数据
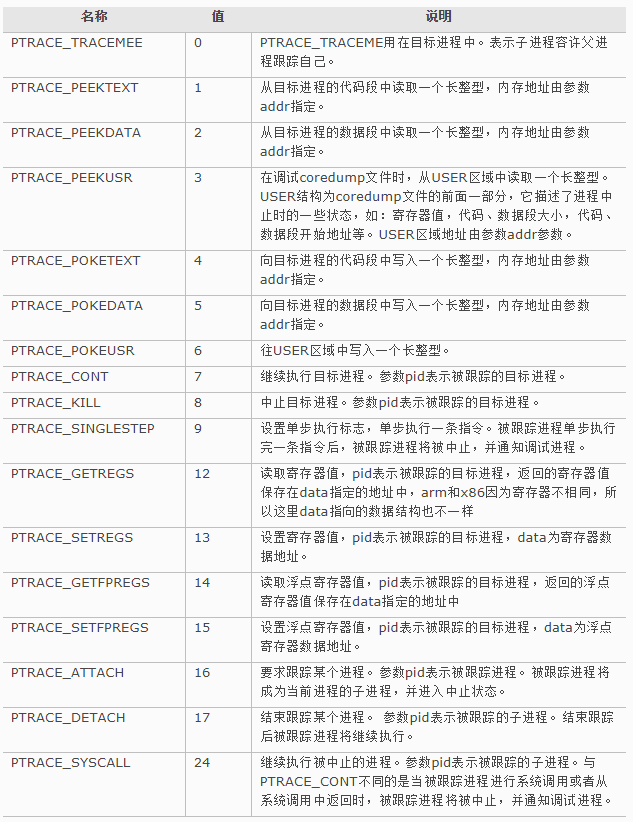
request参数决定了CODE的行为以及后续的参数是如何被使用的,参数request的常用的值如下:
在 i386 平台下(本文所有代码都基于 i386), 系统调用的编号会被放在寄存器 %eax 中,而系统调用的参数会被依次放到 %ebx,%ecx,%edx,%exi 和 %edi中,比如说,对于下面的系统调用:
write(2, "Hello", 5)
汇编代码:
1 movl   $4, %eax
2 movl   $2, %ebx
3 movl   $hello,%ecx
4 movl   $5, %edx
5 int    $0x80
看完上面简单的例子,现在我们来看看 ptrace 又是怎样执行的:
三. 示例代码
 1 #include <sys/ptrace.h>
 2 #include <sys/types.h>
 3 #include <sys/wait.h>
 4 #include <unistd.h>
 5 #include <linux/user.h>   /* For constants
 6                                    ORIG_EAX etc */
 7 int main()
 8 {   pid_t child;
 9     long orig_eax;
10     child = fork();
11     if(child == 0) {
12         ptrace(PTRACE_TRACEME, 0, NULL, NULL);
13         execl("/bin/ls", "ls", NULL);
14     }
15     else {
16         wait(NULL);
17         orig_eax = ptrace(PTRACE_PEEKUSER,
18                           child, 4 * ORIG_EAX,
19                           NULL);
20         printf("The child made a "
21                "system call %ldn", orig_eax);
22         ptrace(PTRACE_CONT, child, NULL, NULL);
23     }
24     return 0;
25 }
gcc -o ptrace ptrace.c
报错:
ptrace.c:6:24: error: linux/user.h: No such file or directory
ptrace.c: In function ‘main’:
ptrace.c:18: error: ‘ORIG_EAX’ undeclared (first use in this function)
ptrace.c:18: error: (Each undeclared identifier is reported only once
ptrace.c:18: error: for each function it appears in.)
ptrace.c:20: warning: incompatible implicit declaration of built-in function ‘printf’
由于我的环境是64 位系统
这里有两个地方有问题
- The ‘linux/user.h’ 不存在
- 64位寄存器 R*X, 所以EAX 改成 RAX
两个修改方案:
1) linux/user.h 改成 sys/reg.h
long original_rax = ptrace(PTRACE_PEEKUSER, child, 8 * ORIG_RAX, NULL);
地址从“4*orig-eax”更改为“8*orig-rax”,因为它是要在用户区域中读取的地址,而user-regs-struct中的orig-rax成员是第15个成员(从0开始)。文件'sys/reg.h'中的orig_rax定义指定其位置:定义orig_rax 15
因为其他成员在64位机器上的大小是8,所以地址是:8*orig_rax
我们看一下头文件结构体


 1 struct user_regs_struct
 2 {
 3   unsigned long int r15;
 4   unsigned long int r14;
 5   unsigned long int r13;
 6   unsigned long int r12;
 7   unsigned long int rbp;
 8   unsigned long int rbx;
 9   unsigned long int r11;
10   unsigned long int r10;
11   unsigned long int r9;
12   unsigned long int r8;
13   unsigned long int rax;
14   unsigned long int rcx;
15   unsigned long int rdx;
16   unsigned long int rsi;
17   unsigned long int rdi;
18   unsigned long int orig_rax;
19   unsigned long int rip;
20   unsigned long int cs;
21   unsigned long int eflags;
22   unsigned long int rsp;
23   unsigned long int ss;
24   unsigned long int fs_base;
25   unsigned long int gs_base;
26   unsigned long int ds;
27   unsigned long int es;
28   unsigned long int fs;
29   unsigned long int gs;
30 };
31
32 struct user
33 {
34   struct user_regs_struct   regs;
35   int               u_fpvalid;
36   struct user_fpregs_struct i387;
37   unsigned long int     u_tsize;
38   unsigned long int     u_dsize;
39   unsigned long int     u_ssize;
40   unsigned long int     start_code;
41   unsigned long int     start_stack;
42   long int          signal;
43   int               reserved;
44   struct user_regs_struct*  u_ar0;
45   struct user_fpregs_struct*    u_fpstate;
46   unsigned long int     magic;
47   char              u_comm [32];
48   unsigned long int     u_debugreg [8];
49 };
2)修改‘linux/user.h’ 为 ‘sys/user.h’
1 struct user_regs_struct regs; 2 ptrace(PTRACE_GETREGS, child, NULL, ®s); 3 printf("The child made a system call %ldn", regs.orig_rax);
第二个更简单,因为它不需要计算位置,但它读取的数据比第一个多
我认为,如果我们直接使用orig_x字段的地址,会更清楚、更容易理解:
1 struct user* user_space = (struct user*)0;
2 long original_rax = ptrace(PTRACE_PEEKUSER, child, &user_space->regs.orig_rax, NULL);
我们现在可以编译和运行它了,但是我们得到了:“子系统调用59”,这与原来的“11”不同,有什么问题吗?
在文件sys/syscall.h中,它包含文件'asm/unistd.h',注释中指出该文件列出了系统调用:
1 /* This file should list the numbers of the system calls the system knows.
2    But instead of duplicating this we use the information available
3    from the kernel sources.  */
4 #include <asm/unistd.h>
是由于头文件asm/unistd.h 包含了不同的文件,根据 __i386__ 和_ILP32__:
1 # ifdef __i386__
2 #  include <asm/unistd_32.h>
3 # elif defined(__ILP32__)
4 #  include <asm/unistd_x32.h>
5 # else
6 #  include <asm/unistd_64.h>
7 # endif
从头文件里面asm/unistd_64.h 我们可以看到64位系统调用:
#define __NR_execve 59
第一个程序搞定, 让我们继续往下看吧, 蹩脚的英语确实让人头疼
第二个示例:读取系统调用的参数
通过调用ptrace并传入PTRACE_PEEKUSER作为第一个参数,我们可以检查子进程中,保存了该进程的寄存器的内容(及其它一些内容)的用户态内存区域(USER area)。内核把寄存器的内容保存到这块区域,就是为了能够让父进程通过ptrace来读取,下面举一个例子来说明一下:
#include <sys/wait.h>
#include <unistd.h> /* For fork() */
#include <sys/ptrace.h>
#include <sys/wait.h>
#include <sys/reg.h> /* For constants ORIG_RAX etc */
#include <sys/user.h>
#include <sys/syscall.h> /* SYS_write */
#include <stdio.h>
int main() {
pid_t child;
long orig_rax;
int status;
int iscalling = 0;
struct user_regs_struct regs;
child = fork();
if(child == 0)
{
ptrace(PTRACE_TRACEME, 0, NULL, NULL);
execl("/bin/ls", "ls", "-l", "-h", NULL);
}
else
{
while(1)
{
wait(&status);
if(WIFEXITED(status))
{
break;
}
orig_rax = ptrace(PTRACE_PEEKUSER,
child, 8 * ORIG_RAX,
NULL);
if(orig_rax == SYS_write)
{
ptrace(PTRACE_GETREGS, child, NULL, ®s); //获取寄存器参数
if(!iscalling) //进入系统调用
{
iscalling = 1;
printf("[Enter SYS_write call] with regs.rdi [%ld], regs.rsi[%ld], regs.rdx[%ld], regs.rax[%ld], regs.orig_rax[%ld]
",
regs.rdi, regs.rsi, regs.rdx,regs.rax, regs.orig_rax);
}
else //离开此次系统调用
{
printf("[Leave SYS_write call] return regs.rax [%ld], regs.orig_rax [%ld]
", regs.rax, regs.orig_rax);
iscalling = 0;
}
}
ptrace(PTRACE_SYSCALL, child, NULL, NULL);
}
}
return 0;
}
输出结果:
[Enter SYS_write call] with regs.rdi [1], regs.rsi[140309977006080], regs.rdx[10], regs.rax[-38], regs.orig_rax[1]
total 40K
[Leave SYS_write call] return regs.rax [10], regs.orig_rax [1]
[Enter SYS_write call] with regs.rdi [1], regs.rsi[140309977006080], regs.rdx[49], regs.rax[-38], regs.orig_rax[1]
-rw-r–r--. 1 root root 7.5K Oct 7 16:56 main.o
[Leave SYS_write call] return regs.rax [49], regs.orig_rax [1]
[Enter SYS_write call] with regs.rdi [1], regs.rsi[140309977006080], regs.rdx[51], regs.rax[-38], regs.orig_rax[1]
-rw-r–r--. 1 root root 17K Oct 6 16:58 Makefile
[Leave SYS_write call] return regs.rax [51], regs.orig_rax [1]
[Enter SYS_write call] with regs.rdi [1], regs.rsi[140309977006080], regs.rdx[49], regs.rax[-38], regs.orig_rax[1]
-rwxr-xr-x. 1 root root 11K Oct 7 16:56 Ptarce
[Leave SYS_write call] return regs.rax [49], regs.orig_rax [1]
至于上面的例子中出现的调用:wait(&status),这是个典型的用于判断子进程是被 ptrace 停住还是已经运行结束了的用法,变量 status 用于标记子进程是否已经结束退出,关于这个 wait() 和 WIFEXITED 的更多细节,读者可以自行查看一下manual(man 2).
还有更经典的示例, 可以参考:https://www.linuxjournal.com/article/6100?page=0,0
四. ptrace 反调试:
进程跟踪器,类似于gdb watch的调试方法, Linux 系统gdb等调试器,都是通过ptrace系统调用实现
ptrace系统调用主要是父进程用来观察和控制子进程的执行过程、检查并替换子进程执行序列或者寄存器值的一种手段。主要用于实现断点调试和跟踪系统调用
但是如果你自己写了一个软件又不想被别人调试查看内部, 这时候就需要采取手段防止别人调试,反调试从逻辑上分大概分为, 一种是直接屏蔽调试器挂载, 另一种就是根据特征手动检测调试器挂载. 当然也分为使用函数实现 和 直接使用内联 asm 实现
这里也推荐一个个人感觉比较好的文章:http://bbs.iosre.com/t/topic/9351
这里介绍一下如何进行反调试:
ptrace有个参数 PT_DENY_ATTACH :它可以防止调试程序(gdb、dtrace等)在内核级别调试二进制文件
ptrace(PT_DENY_ATTACH, 0, 0, 0);
进行系统调用,防止符号断点调试进行定位汇编代码
通过asm链接汇编代码,通过汇编代码svc #0x80触发中断。通过syscall头文件找到底层函数名对应的定义数值
asm(
	"mov x0,#31
"
	"mov x1,#0
"
	"mov x2,#0
"
	"mov x3,#0
"
	"mov w16,#26
"//26就是prase,上面四个是传入的参数
	"svc  #0x80"//触发中断
)
封装ptrace
 1 static __always_inline volatile long ptrace(
 2     enum __ptrace_request request,
 3     pid_t pid,
 4     void *addr,
 5     void *data)
 6 {
 7     __asm__ volatile(
 8         "mov %0, %%rdi
"
 9         "mov %1, %%rsi
"
10         "mov %2, %%rdx
"
11         "mov %3, %%r10
"
12         "mov $0x65, %%rax
"
13         "syscall"
14         :
15         : "g"(request), "g"(pid), "g"(addr), "g"(data));
16     asm("mov %%rax, %0"
17         : "=r"(ret));
18     return (void *)ret;
19 }
是必须保证,可执行文件没被修改的情况下有效的。如果可执行文件被静态反汇编。找到ptrace系统调用的代码将其替换成无效指令。那反调试策略将失效,所以,这样的保护还是得基于,可执行代码的加密
五. ptrace 代码注入
ptrace是Unix系列系统的系统调用之一。其主要功能是实现对进程的追踪。对目标进程,进行流程控制,用户寄存器值读取&写入操作,内存进行读取&修改。这样的特性,就非常适合,用于编写实现,远程代码注入。大部分的病毒会使用到这一点,实现,自用空间注入,rip位置直接注入,text段与data段之间的空隙注入
当使用要跟踪的pid调用ptrace(PTRACE_ATTACH, ..)时,它大致相当于调用ptrace(PTRACE_TRACEME, ..)并成为跟踪进程的子进程。跟踪的进程被发送一个SIGSTOP,因此我们可以像往常一样检查和修改进程。修改或跟踪完成后,可以通过调用ptrace(PTRACE_DETACH, ..)让跟踪的进程继续执行
下面是一个小示例跟踪程序的代码:
1 int main()
2 {   int i;
3     for(i = 0;i < 10; ++i) {
4         printf("My counter: %d
", i);
5         sleep(2);
6     }
7     return 0;
8 }
保存文件 dummy2.c, 并且后台运行
1 gcc -o dummy2 dummy2.c
2 ./dummy2 &
现在我们attach到这个程序上去
1 #include <sys/ptrace.h> 2 #include <sys/types.h> 3 #include <sys/wait.h> 4 #include <unistd.h> 5 #include <sys/reg.h> /* For user_regs_struct 6 etc. */ 7 int main(int argc, char *argv[]) 8 { pid_t traced_process; 9 struct user_regs_struct regs; 10 long ins; 11 if(argc != 2) { 12 printf("Usage: %s <pid to be traced> ", 13 argv[0], argv[1]); 14 exit(1); 15 } 16 traced_process = atoi(argv[1]); 17 ptrace(PTRACE_ATTACH, traced_process, 18 NULL, NULL); 19 wait(NULL); 20 ptrace(PTRACE_GETREGS, traced_process, 21 NULL, ®s); 22 ins = ptrace(PTRACE_PEEKTEXT, traced_process, 23 regs.eip, NULL); 24 printf("EIP: %lx Instruction executed: %lx ", 25 regs.eip, ins); 26 ptrace(PTRACE_DETACH, traced_process, 27 NULL, NULL); 28 return 0; 29 }
上面的程序只是附到一个进程上,等待它停止,检查它的eip(指令指针)并进行分离。
在跟踪过程停止后,使用ptrace(PTRACE_POKETEXT, ..)和ptrace(PTRACE_POKEDATA, ..)注入代码。
设置断点:
调试器如何设置断点?通常,它们用trap指令替换要执行的指令,以便当跟踪的程序停止时,跟踪程序(调试器)可以检查它。一旦跟踪程序继续跟踪过程,它将替换原来的指令。这里有一个例子:
1 #include <sys/ptrace.h> 2 #include <sys/types.h> 3 #include <sys/wait.h> 4 #include <unistd.h> 5 #include <sys/user.h> 6 #include <stdio.h> 7 8 const int long_size = sizeof(long); 9 void getdata(pid_t child, long addr, 10 char *str, int len) 11 { char *laddr; 12 int i, j; 13 union u { 14 long val; 15 char chars[long_size]; 16 }data; 17 i = 0; 18 j = len / long_size; 19 laddr = str; 20 while(i < j) { 21 data.val = ptrace(PTRACE_PEEKDATA, child, 22 addr + i * 4, NULL); 23 memcpy(laddr, data.chars, long_size); 24 ++i; 25 laddr += long_size; 26 } 27 j = len % long_size; 28 if(j != 0) { 29 data.val = ptrace(PTRACE_PEEKDATA, child, 30 addr + i * 4, NULL); 31 memcpy(laddr, data.chars, j); 32 } 33 str[len] = '�'; 34 } 35 void putdata(pid_t child, long addr, 36 char *str, int len) 37 { char *laddr; 38 int i, j; 39 union u { 40 long val; 41 char chars[long_size]; 42 }data; 43 i = 0; 44 j = len / long_size; 45 laddr = str; 46 while(i < j) { 47 memcpy(data.chars, laddr, long_size); 48 ptrace(PTRACE_POKEDATA, child, 49 addr + i * 4, data.val); 50 ++i; 51 laddr += long_size; 52 } 53 j = len % long_size; 54 if(j != 0) { 55 memcpy(data.chars, laddr, j); 56 ptrace(PTRACE_POKEDATA, child, 57 addr + i * 4, data.val); 58 } 59 } 60 int main(int argc, char *argv[]) 61 { pid_t traced_process; 62 struct user_regs_struct regs, newregs; 63 long ins; 64 /* int 0x80, int3 */ 65 char code[] = {0xcd,0x80,0xcc,0}; 66 char backup[4]; 67 if(argc != 2) { 68 printf("Usage: %s <pid to be traced> ", 69 argv[0], argv[1]); 70 exit(1); 71 } 72 traced_process = atoi(argv[1]); 73 ptrace(PTRACE_ATTACH, traced_process, 74 NULL, NULL); 75 wait(NULL); 76 ptrace(PTRACE_GETREGS, traced_process, 77 NULL, ®s); 78 /* Copy instructions into a backup variable */ 79 getdata(traced_process, regs.rip, backup, 3); 80 /* Put the breakpoint */ 81 putdata(traced_process, regs.rip, code, 3); 82 /* Let the process continue and execute 83 the int 3 instruction */ 84 ptrace(PTRACE_CONT, traced_process, NULL, NULL); 85 wait(NULL); 86 printf("The process stopped, putting back " 87 "the original instructions "); 88 printf("Press <enter> to continue "); 89 getchar(); 90 putdata(traced_process, regs.eip, backup, 3); 91 /* Setting the eip back to the original 92 instruction to let the process continue */ 93 ptrace(PTRACE_SETREGS, traced_process, 94 NULL, ®s); 95 ptrace(PTRACE_DETACH, traced_process, 96 NULL, NULL); 97 return 0; 98 }
这里简单提一下为什么改rip
RIP --- x64体系
EIP --- x86体系
RIP/EIP注入原理:
1 挂起目标线程,需要用到 SuspendThread 函数
2 挂起之后获取目标线程的上下文,需要用到 GetThreadContext函数
这个函数可以获得一个CONTEXT结构体封装的数据。这个结构体的定义在winnt.h头文件中
结构体里面存储了当前线程的上下文信息,比如当前线程的RIP/EIP在哪里,通用寄存器的值是
多少等等。
3 RIP/EIP注入关键就是修改Context中的RIP/EIP寄存器。使得要执行的代码强制跳转到我们
指定的代码。最后将上下文设置回去,这用到 SetThreadContext 函数,最后执行ResumeThread
函数,将挂起线程恢复执行。
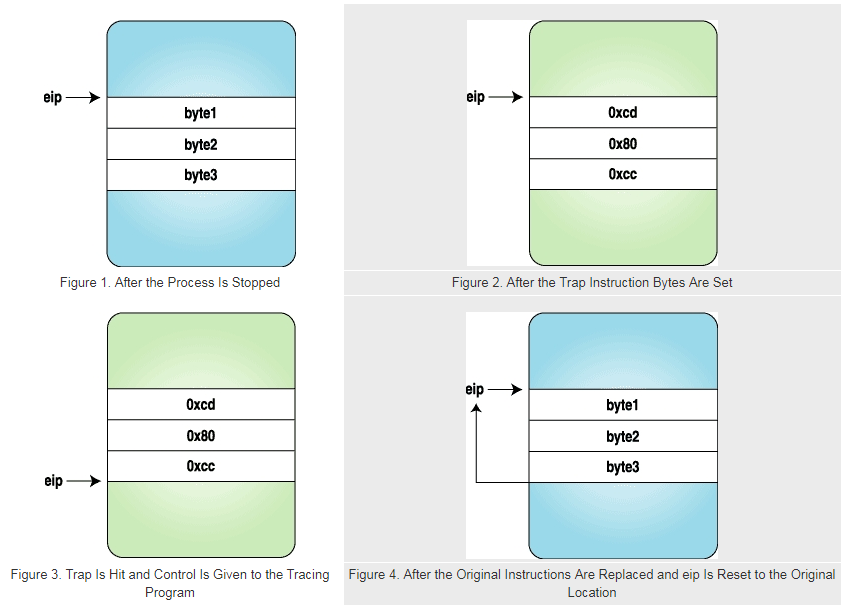
这里,我们用陷阱指令的代码替换这三个字节,当进程停止时,我们替换原始指令并将eip重置为原始位置. 上图阐明了执行上述程序时指令流的外观(图示针对32位系统, eip32位)
现在我们已经清楚了断点是如何设置的,让我们将一些代码字节注入到正在运行的程序中。这些代码字节将打印“hello world”
下面的程序是一个简单的“hello world”程序,根据我们的需要进行了修改。用以下软件编译程序:
 1 gcc -o hello hello.c
 2 void main()
 3 {
 4 __asm__("
 5          jmp forward
 6 backward:
 7          popl   %esi      # Get the address of
 8                           # hello world string
 9          movl   $4, %eax  # Do write system call
10          movl   $2, %ebx
11          movl   %esi, %ecx
12          movl   $12, %edx
13          int    $0x80
14          int3             # Breakpoint. Here the
15                           # program will stop and
16                           # give control back to
17                           # the parent
18 forward:
19          call   backward
20          .string "Hello World\n""
21        );
22 }
这里需要前后跳转才能找到“hello world”字符串的地址。
利用GDB反汇编
 1 (gdb) disassemble main
 2 Dump of assembler code for function main:
 3 0x80483e0 <main>:       push   %ebp
 4 0x80483e1 <main+1>:     mov    %esp,%ebp
 5 0x80483e3 <main+3>:     jmp    0x80483fa <forward>
 6 End of assembler dump.
 7 (gdb) disassemble forward
 8 Dump of assembler code for function forward:
 9 0x80483fa <forward>:    call   0x80483e5 <backward>
10 0x80483ff <forward+5>:  dec    %eax
11 0x8048400 <forward+6>:  gs
12 0x8048401 <forward+7>:  insb   (%dx),%es:(%edi)
13 0x8048402 <forward+8>:  insb   (%dx),%es:(%edi)
14 0x8048403 <forward+9>:  outsl  %ds:(%esi),(%dx)
15 0x8048404 <forward+10>: and    %dl,0x6f(%edi)
16 0x8048407 <forward+13>: jb     0x8048475
17 0x8048409 <forward+15>: or     %fs:(%eax),%al
18 0x804840c <forward+18>: mov    %ebp,%esp
19 0x804840e <forward+20>: pop    %ebp
20 0x804840f <forward+21>: ret
21 End of assembler dump.
22 (gdb) disassemble backward
23 Dump of assembler code for function backward:
24 0x80483e5 <backward>:   pop    %esi
25 0x80483e6 <backward+1>: mov    $0x4,%eax
26 0x80483eb <backward+6>: mov    $0x2,%ebx
27 0x80483f0 <backward+11>:        mov    %esi,%ecx
28 0x80483f2 <backward+13>:        mov    $0xc,%edx
29 0x80483f7 <backward+18>:        int    $0x80
30 0x80483f9 <backward+20>:        int3
31 End of assembler dump.
我们需要将机器码字节从main+3取到back +20,总共是41字节。机器代码可以用GDB中的x命令查看:
1 (gdb) x/40bx main+3
2 <main+3>: eb 15 5e b8 04 00 00 00
3 <backward+6>: bb 02 00 00 00 89 f1 ba
4 <backward+14>: 0c 00 00 00 cd 80 cc
5 <forward+1>: e6 ff ff ff 48 65 6c 6c
6 <forward+9>: 6f 20 57 6f 72 6c 64 0a
现在我们有了要执行的指令字节。为什么等待?我们可以使用与前面示例相同的方法注入它们。下面是源代码;这里只给出了主要功能:
1 int main(int argc, char *argv[]) 2 { pid_t traced_process; 3 struct user_regs_struct regs, newregs; 4 long ins; 5 int len = 41; 6 char insertcode[] = 7 "xebx15x5exb8x04x00" 8 "x00x00xbbx02x00x00x00x89xf1xba" 9 "x0cx00x00x00xcdx80xccxe8xe6xff" 10 "xffxffx48x65x6cx6cx6fx20x57x6f" 11 "x72x6cx64x0ax00"; 12 char backup[len]; 13 if(argc != 2) { 14 printf("Usage: %s <pid to be traced> ", 15 argv[0], argv[1]); 16 exit(1); 17 } 18 traced_process = atoi(argv[1]); 19 ptrace(PTRACE_ATTACH, traced_process, 20 NULL, NULL); 21 wait(NULL); 22 ptrace(PTRACE_GETREGS, traced_process, 23 NULL, ®s); 24 getdata(traced_process, regs.eip, backup, len); 25 putdata(traced_process, regs.eip, 26 insertcode, len); 27 ptrace(PTRACE_SETREGS, traced_process, 28 NULL, ®s); 29 ptrace(PTRACE_CONT, traced_process, 30 NULL, NULL); 31 wait(NULL); 32 printf("The process stopped, Putting back " 33 "the original instructions "); 34 putdata(traced_process, regs.eip, backup, len); 35 ptrace(PTRACE_SETREGS, traced_process, 36 NULL, ®s); 37 printf("Letting it continue with " 38 "original flow "); 39 ptrace(PTRACE_DETACH, traced_process, 40 NULL, NULL); 41 return 0; 42 }
将代码注入空闲内存中
在前面的示例中,我们将代码直接注入执行指令流。但是,调试器可能会与这种行为混淆,所以让我们找到进程中的空闲内存并将代码注入其中。
我们可以通过检查跟踪进程的/proc/pid/maps文件来找到空闲内存。下面的函数会找到这个的起始地址:
 1 long freespaceaddr(pid_t pid)
 2 {
 3     FILE *fp;
 4     char filename[30];
 5     char line[85];
 6     long addr;
 7     char str[20];
 8     sprintf(filename, "/proc/%d/maps", pid);
 9     fp = fopen(filename, "r");
10     if(fp == NULL)
11         exit(1);
12     while(fgets(line, 85, fp) != NULL) {
13         sscanf(line, "%lx-%*lx %*s %*s %s", &addr,
14                str, str, str, str);
15         if(strcmp(str, "00:00") == 0)
16             break;
17     }
18     fclose(fp);
19     return addr;
20 }
关于代码注入还有很多需要学习的