% Good Node Set Matalb-code
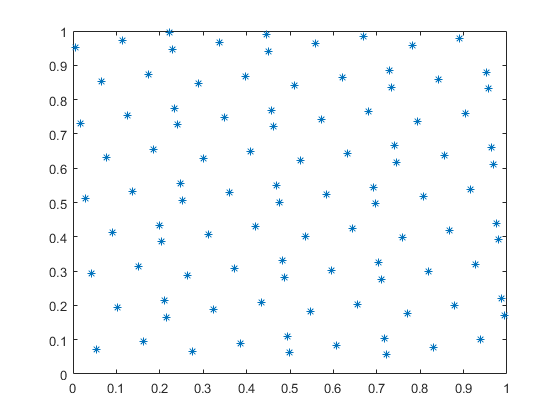
function [GD] = Goodnode(M,N)
% M is the number of points; N is the dimension
if (nargin==0)
M=100;
N=2;
end
%%
tmp1 = [1: M]'*ones(1, N);
Ind = [1: N];
prime1 = primes(100*N);
[p,q]=find(prime1 >= (2*N+3));
tmp2 = (2*pi.*Ind)/prime1(1,q(1));
tmp2 = 2*cos(tmp2);
tmp2 = ones(M,1)*tmp2;
GD = tmp1.*tmp2;
GD = mod(GD,1);
%% For debuging
plot(GD(:,1),GD(:,2),'*');
end
from matplotlib import pyplot as plt
import numpy as np
import sympy
def GoodNode(m, d, lb, ub):
"""
:param m: 点的数目
:param d: 点的维数
:param lb: 下界
:param ub: 上界
"""
temp1 = np.arange(1, m + 1).reshape(-1, 1) * np.ones((1, d))
ind = np.arange(1, d + 1)
prime = list(sympy.sieve.primerange(0, 100 * d))
idx = np.where(np.array(prime) >= (2 * d + 3))[0]
temp2 = (2 * np.pi * ind) / prime[idx[1]]
temp2 = 2 * np.cos(temp2)
temp2 = np.ones((m, 1)) * temp2
gd = temp1 * temp2
gd = np.mod(gd, 1)
pop = lb + gd*(ub - lb)
return pop
if __name__ == "__main__":
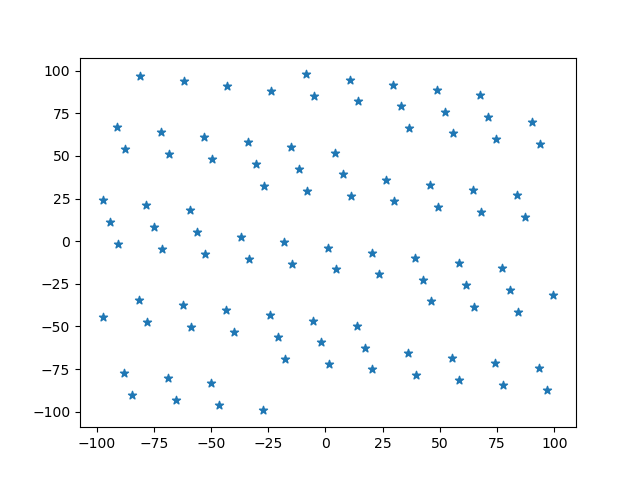
p = GoodNode(100, 2, -100, 100)
plt.figure()
plt.scatter(p[:, 0], p[:, 1], marker="*")
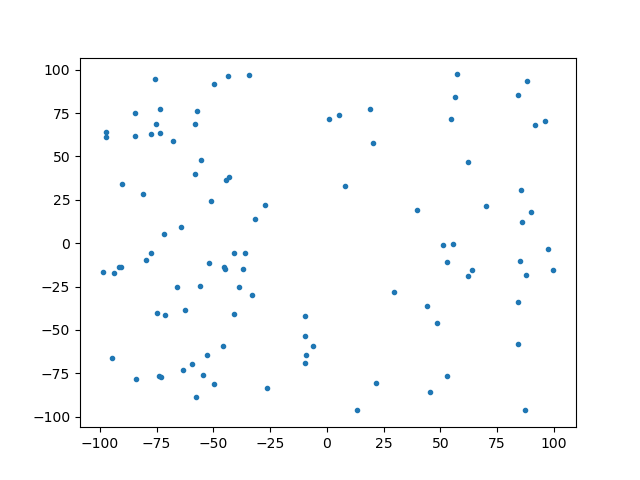
p1 = -100 + np.random.rand(100, 2) * 200
plt.figure()
plt.scatter(p1[:, 0], p1[:, 1], marker=".")
plt.show()