CSV- 绘制气温图表
资源:
链接: https://pan.baidu.com/s/1kqREk-sRnOcC34Mh1lBDHQ 提取码: uyx7
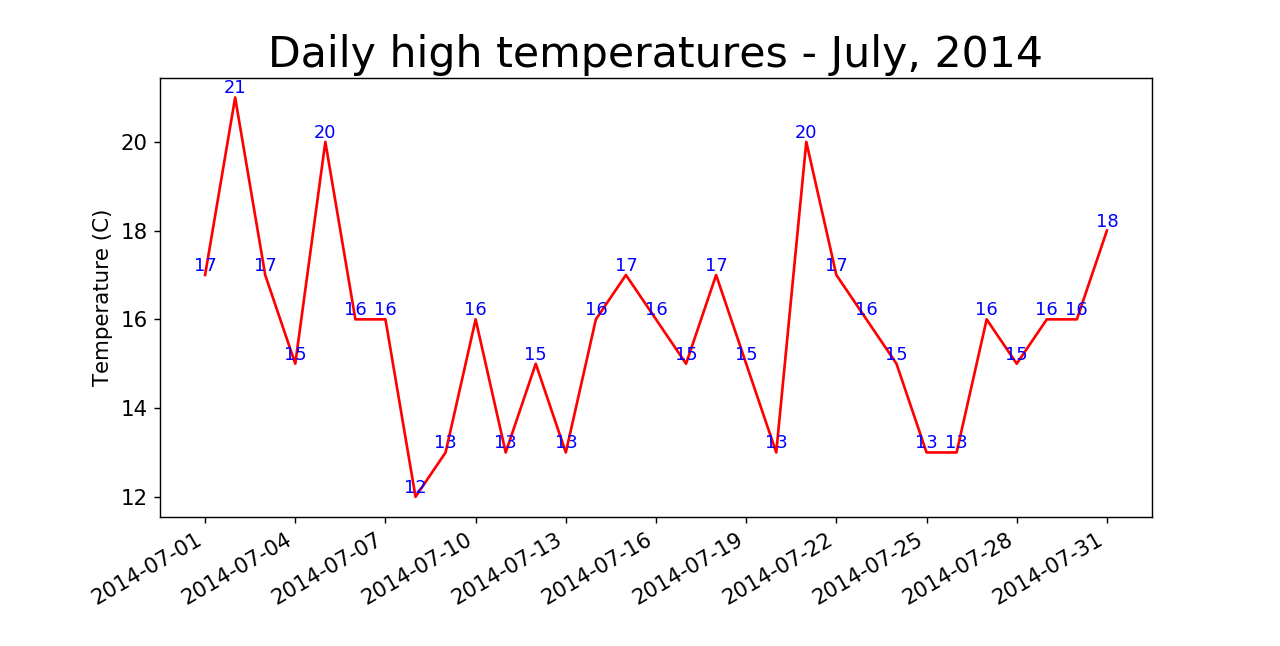
# highs_lows_Jul.py 最高温及最低温
import csv

from matplotlib import pyplot as plt
from datetime import datetime

# 从文件中获取最高气温
filename = 'data/sitka_weather_07-2014.csv'
with open(filename) as f:  # 打开文件
    reader = csv.reader(f)  # 调用csv.reader(),创建一个与文件相关联的阅读器对象
    header_row = next(reader)  # 阅读下一行(标题行)

    """
    for index, column_header in enumerate(header_row):  # 获取索引及值
        print(index, column_header)
    """

    """
    dates = [datetime.strptime(row[0], '%Y-%m-%d') for row in reader]  # 使用strptime方法设置日期的格式
    highs = [int((int(row[1]) - 32) / 1.8) for row in reader] # Max TemperatureF列 每行的[1]索引处,并将华氏度转换为摄氏度
    """

    datas = [[datetime.strptime(row[0], '%Y-%m-%d'), int((int(row[1]) - 32) / 1.8)] for row in reader]
    dates = [row[0] for row in datas]  # or [datas[row][0] for row in range(len(datas))]
    highs = [row[1] for row in datas]  # or [datas[row][1] for row in range(len(datas))]

# 根据数据绘制图形
fig = plt.figure(dpi=128, figsize=(10, 6))
plt.plot(dates, highs, c='red')

# 设置图形的格式
plt.title('Daily high temperatures - July, 2014', fontsize=24)
plt.xlabel('', fontsize=12)
fig.autofmt_xdate()  # 绘制斜的日期标签,以免重叠
plt.ylabel('Temperature (C)', fontsize=12)
plt.tick_params(axis='both', which='major', labelsize=12)

# 添加数值
for x, y in zip(dates, highs):
    plt.text(x, y, y, ha='center', va='bottom', color='blue')

# 修改刻度
plt.xticks(dates[::3])

# 显示阿拉斯加锡特卡2014年7越每日最高气温折线图
plt.show()
# highs_lows_Jul.py 最高温及最低温
import csv

from matplotlib import pyplot as plt
from datetime import datetime

# 从文件中获取最高气温
filename = 'data/sitka_weather_2014.csv'
with open(filename) as f:  # 打开文件
    reader = csv.reader(f)  # 调用csv.reader(),创建一个与文件相关联的阅读器对象
    header_row = next(reader)  # 阅读下一行(标题行)

    datas = [[datetime.strptime(row[0], '%Y-%m-%d'), int((int(row[1]) - 32) / 1.8)] for row in reader]
    dates = [row[0] for row in datas]
    highs = [row[1] for row in datas]

# 根据数据绘制图形
fig = plt.figure(dpi=128, figsize=(10, 6))
plt.plot(dates, highs, c='red')

# 设置图形的格式
plt.title('Daily high temperatures - 2014', fontsize=24)
plt.xlabel('', fontsize=12)
fig.autofmt_xdate()  # 绘制斜的日期标签,以免重叠
plt.ylabel('Temperature (C)', fontsize=12)
plt.tick_params(axis='both', which='major', labelsize=12)

# 修改刻度
plt.xticks(dates[::31])

# 显示阿拉斯加锡特卡2014年每日最高气温折线图
plt.show()

# highs_lows_Jul.py 最高温及最低温
import csv

from matplotlib import pyplot as plt
from datetime import datetime

# 从文件中获取最高气温
filename = 'data/sitka_weather_2014.csv'
with open(filename) as f:  # 打开文件
    reader = csv.reader(f)  # 调用csv.reader(),创建一个与文件相关联的阅读器对象
    header_row = next(reader)  # 阅读下一行(标题行)

    datas = [[datetime.strptime(row[0], '%Y-%m-%d'), int((int(row[1]) - 32) / 1.8), int((int(row[3]) - 32) / 1.8)] for row in reader]
    dates = [row[0] for row in datas]
    highs = [row[1] for row in datas]
    lows = [row[2] for row in datas]

# 根据数据绘制图形
fig = plt.figure(dpi=128, figsize=(10, 6))
plt.plot(dates, highs, c='red', alpha=0.5)
plt.plot(dates, lows, c='blue', alpha=0.5)

# 给图表区域着色
plt.fill_between(dates, highs, lows, facecolor='blue', alpha=0.2)  # fill_between(x, y, y, facecolor, alpha)
# alpha值指定颜色的透明度(0为完全透明,1表示完全不透明)


# 设置图形的格式
plt.title('Daily high and low temperatures - 2014', fontsize=24)
plt.xlabel('', fontsize=12)
fig.autofmt_xdate()  # 绘制斜的日期标签,以免重叠
plt.ylabel('Temperature (C)', fontsize=12)
plt.tick_params(axis='both', which='major', labelsize=12)

# 修改刻度
plt.xticks(dates[::31])

# 显示阿拉斯加锡特卡2014年每日最高气温折线图
plt.show()
