1. 简单布局add_subplot/subplot/subplots
1.1 Figure.add_subplot(*args,**kwargs)
简单布局通过方法来完成,它返回的是Axes实例。当然你也可以通过pyplot.subplot(*args,**kwargs)函数来完成,他返回的也是Axes实例,该函数只是一个便利函数。
SubPlot类是Axes类的子类。因此SubPlot对象也是Axes对象。
参数:
axisbg关键字参数:指定subplot的背景色polar关键字参数:指定subplot是否是极坐标。默认为Falseprojection:指定坐标方式,可以为:'aitoff'、'hammer'、'lambert'、'mollweide'、'polar'、'rectilinear'。当projection='polar'等价于ploar=Truesharex关键字参数:指定subplot与其他Axes(由该参数值指定)共享xaxis attributesharey关键字参数:指定subplot是否与其他Axes(由该参数值指定)共享yaxis attribute
1.2 matplotlib.pyplot.subplot(nrows,ncols,plot_number)
nrows和ncols将图表划分成nrows*ncols大小的网格区域,每一个区域都能存放一个SubPlot;该函数创建plot_number位置处的SubPlot-axes。其中plot_number起始于1,最大值为nrows*ncols。
如果nrows、ncols、plot_number都是个位数,则你可以指定一个三位数来简化函数调用matplotlib.pyplot.subplot(integer),其中百分位代表nrows,十分位代表ncols,各位代表plot_number。
1.3 matplotlib.pyplot.subplots()
一次性创建多个subPlot,而pyplot.subplot()每次只会创建一个SubPlot。
参数:
nrows:行数,默认为1;ncols:列数,默认为1sharex:- 如果为
True,则所有SubPlot的X axis被共享。此时只有最后一行的X轴可见。 - 如果为
False,则SubPlot的X axis不共享,每一个SbuPlot的X轴可见。 - 如果为字符串
all,则等效于True - 如果为字符串
none,则当小于False - 如果为字符串
row,则每一行的SubPlot共享一个X轴(与False等效) - 如果为字符串
col,则每一列的SubPlot共享一个X轴(与True等效) sharey:- 如果为
True,则所有SubPlot的Y axis被共享。此时只有第一列的Y轴可见。 - 如果为
False,则SubPlot的Y axis不共享,每一个SbuPlot的Y轴可见。 - 如果为字符串
all,则等效于True - 如果为字符串
none,则当小于False - 如果为字符串
row,则每一行的SubPlot共享一个Y轴(与True等效) - 如果为字符串
col,则每一列的SubPlot共享一个Y轴(与False等效)
- 如果为
squeeze:- 如果为
True:- 如果只创建了一个
SubPlot,则返回一个变量(创建的SubPlot对象) - 如果创建了
N*1或者1*N个SubPlot,则返回一个1维向量 - 如果创建了
N*M个SubPlot(其中N>1,M>1),则返回一个2维向量
- 如果只创建了一个
- 如果为False则始终返回一个2维向量
- 如果为
subplot_kw:一个字典参数,用于传递给Axes.add_subplot()来创建SubPlotgridspec_kw:一个字典参数,用于传递给GridSpec构造函数来创建SubPlot存放的网格fig_kw:一个字典参数,用于传递给pyplot.figure()函数。所有前述未能识别的感激案子参数都会传到这里。
其返回值为figure,ax。其中figure是一个Figure对象;ax取决于squeeze参数。
举例:
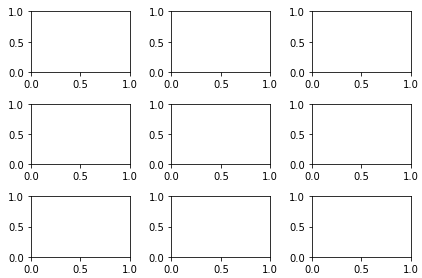
import matplotlib
from matplotlib import pyplot as plt
plt.subplots(3,3)
plt.tight_layout()
plt.show()
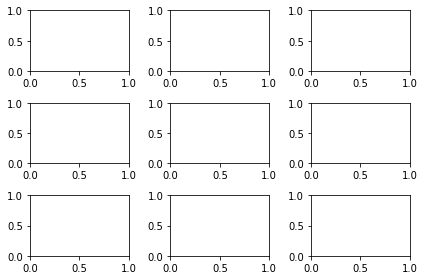
plt.subplots(3,3,sharex=True) # 等价于sharex='all'
plt.tight_layout()
plt.show()

plt.subplots(3,3,sharex='row')
plt.tight_layout()
plt.show()
2.pyplot.subplot2grid()
2.1 使用pyplot.subplot2grid()函数时,你只需要提供网格形状以及SubPlot位置即可。
ax=pyplot.subplot2grid((2,2),(0,0))
# 它等价于
ax=pyplot.subplot(2,2,1) # 其中subplot2grid()的位置坐标从0开始。
subplot2grid()支持SubPlot横跨或者纵跨多个单元格。colspan关键字参数指定纵向的跨度;rowspan关键字参数指定横向的跨度。
举例:
import matplotlib.pyplot as plt
plt.subplot2grid((3,3),(0,0),colspan=3)
plt.subplot2grid((3,3),(1,0),colspan=2)
plt.subplot2grid((3,3),(1,2),colspan=2)
plt.subplot2grid((3,3),(2,0))
plt.tight_layout()
plt.show()

3. GridSpec 和 SubplotSpec
3.1 matplotlib.gridspec.GridSpec
你可以直接创建matplotlib.gridspec.GridSpec,然后通过它来创建SubPlot。如:
gs=matplotlib.gridspec.GridSpec(2,2) #网格2行2列
matplotlib.pyplot.subplot(gs[0,0])
等价于matplotlib.pyplot.subplot2grid((2,2),(0,0))
GridSpec对象提供了类似array的索引方法,其索引的结果是一个SubplotSpec对象实例。如果你想创建横跨多个网格的SubplotSpec,那么你需要对GridSpec对象执行分片索引,如pyplot.subplot(gs[0,:-1])。
举例:
import matplotlib.pyplot as plt
from matplotlib import gridspec
gs = gridspec.GridSpec(3,3)
plt.subplot(gs[0,:]) # 添加SubplotSpec
plt.subplot(gs[1,:-1])
plt.subplot(gs[1:,-1])
plt.subplot(gs[-1,0])
plt.tight_layout()
plt.show()

3.2 matplotlib.gridspec.GridSpec.update
如果你使用GridSpec,那么你可以调整由GridSpec创建的SubplotSpec的layout parameter。如:
gs=gridspec.GridSpec(3,3)
gs.update(left=0.05,right=0.48,wspace=0.05)
这种用法类似于subplots_adjust,但是它仅仅影响由本GridSpec创建的SubplotSpec。其中gs.update()的关键字参数有:
left关键字参数:subplot左侧宽度right关键字参数:subplot右侧宽度bottom关键字参数:subplot底部高度top关键字参数:subplot顶部高度wspace关键字参数:subplot之间的空白宽度hspace关键字参数:subplot之间的空白的高度
3.4 gridspec.GridSpecFromSubplotSpec
你可以从SubplotSpec创建GridSpec。此时layout parameter由该SubplotSpec指定。如:
gs0=gridspec.GridSpec(1,2)
gs00=gridspec.GridSpecFromSubplotSpec(3,3,subplot_spec=gs0[0])
matplotlib.gridspec.GridSpecFromSubplotSpec(nrows, ncols, subplot_spec,wspace=None, hspace=None,height_ratios=None,width_ratios=None)
创建一个GridSpec,它的subplot layout parameter继承自指定的SubplotSpec。 其中nrows为网格行数,ncols为网格列数,subplot_spec为指定的SubplotSpec。

3. 5 默认情况下,GridSpec创建的网格都是相同大小的。当然你可以调整相对的高度和宽度。注意这里只有相对大小(即比例)是有意义的,绝对大小值是没有意义的。如:
gs=gridspec.GridSpec(2,2,width_ratios=[1,2],height_ratios=[4,1]
plt.subplot(gs[0]
....
width_ratios关键字参数:指定了一行中,各列的宽度比例(有多少列就有多少个数字);height_ratios关键字参数:指定了一列中,各行的高度比例(有多少行就有多少个数字)。
举例:
import matplotlib.pyplot as plt
from matplotlib import gridspec
gs = gridspec.GridSpec(2,2,width_ratios=[1,2],height_ratios=[4,1]) # 调整相对宽高
plt.subplot(gs[0]) # 添加SubplotSpec
plt.subplot(gs[1])
plt.subplot(gs[2])
plt.subplot(gs[3])
plt.tight_layout()
plt.show()

3.6 GridSpec.tight_layout()
GridSpec.tight_layout(fig, renderer=None, pad=1.08, h_pad=None, w_pad=None,rect=None):tight_layout能够自动调整subplot param从而使得subplot适应figure area。 它仅仅检查ticklabel、axis label、title等内容是否超出绘制区域。
参数:
fig关键字参数:Figure对象,图表。pad关键字参数:一个浮点数,单位是fontsize,表示figure edge和edges of subplots之间的 填充区域。h_pad关键字参数:一个浮点数,单位是fontsize,示subplots之间的高度,默认为pad。w_pad关键字参数:一个浮点数,单位是fontsize,示subplots之间的宽度,默认为pad。rect关键字参数:如果给定了该参数为一个列表或元组(是一个矩形的四要素,分别代表左下角坐标,宽度,高度),则指定了网格的轮廓矩形,所有的subplots都位于该矩形中。其坐标系是figure coordinate,从[0...1],如果没有提供该参数,则默认为(0, 0, 1, 1)。
当然你可以使用matplotlib.pyplot.tight_layout()来达到同样的效果。
举例:
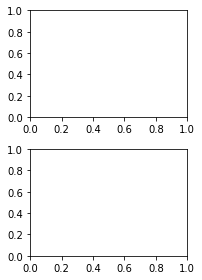
import matplotlib.pyplot as plt
from matplotlib import gridspec
fig = plt.figure()
gs1 = gridspec.GridSpec(2,1)
fig.add_subplot(gs1[0])
fig.add_subplot(gs1[1])
gs1.tight_layout(fig,rect=[0,0,0.5,1])
fig.show()
参考文献: