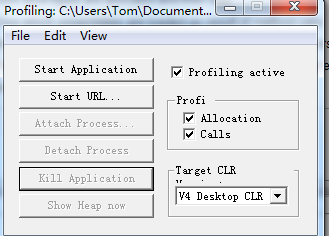
原文:
https://blog.csdn.net/kntao/article/details/7077804
CLR Profile能够看到应用程序的内存堆栈情况并且能够查询垃圾回收机制的行为。利用CLR Profile可以确定你的代码哪儿分配了太多内存,从而导致垃圾回收机制的执行,哪些代码长时间的占有内存。不过CLR Profile不适合在生产环境下使用,因为如果用它,会使你的应用程序的性能下降10倍甚至100倍。
请从http://download.microsoft.com/download/4/4/2/442d67c7-a1c1-4884-9715-803a7b485b82/clr%20profiler.exe下载CLR Profile
CLR Profile 可以做:
- 查看托管堆上的对象
- 查看托管堆中存活的对象
- 谁引用了托管堆上的对象
- 垃圾回收机制在整个应用程序的生命周期内都做了什么
| View | Description |
|---|---|
| Histogram Allocated Types | Gives you a high-level view of what object types are allocated (by allocation size) during the lifetime of your application. This view also shows those objects that are allocated in the large object heap (objects larger than 85 KB).
This view allows you to click parts of the graph so that you can see which methods allocated which objects. |
| Histogram Relocated Types | Displays the objects that the garbage collector has moved because they have survived a garbage collection. |
| Objects By Address | Provides a picture of what is on the managed heap at a given time. |
| Histogram By Age | Allows you to see the lifetime of the objects on the managed heap. |
| Allocation Graph | Graphically displays the call stack for how objects were allocated. You can use this view to:
-See the cost of each allocation by method. -Isolate allocations that you were not expecting. -View possible excessive allocations by a method. |
| Assembly, Module, Function, and Class Graph | These four views are very similar. They allow you to see which methods pulled in which assemblies, functions, modules, or classes. |
| Heap Graph | Shows you all of the objects in the managed heap, along with their connections. |
| Call Graph | Lets you see which methods call which other methods and how frequently.
You can use this graph to get a feel for the cost of library calls and to determine how many calls are made to methods and which methods are called. |
| Time Line | Displays what the garbage collector does over the lifetime of the application. Use this view to:
-Investigate the behavior of the garbage collector. -Determine how many garbage collections occur at the three generations (Generation 0, 1, and 2) and how frequently they occur. -Determine which objects survive garbage collection and are promoted to the next generation. You can select time points or intervals and right-click to show who allocated memory in the interval. |
| Call Tree View | Provides a text-based, chronological, hierarchical view of your application's execution. Use this view to:
-See what types are allocated and their size. -See which assemblies are loaded as result of method calls. -Analyze the use of finalizers, including the number of finalizers executed. -Identify methods where Close or Dispose has not been implemented or called, thereby causing a bottleneck. -Analyze allocations that you were not expecting. |


using System;
using System.Collections.Generic;
using System.Linq;
using System.Text;

namespace ConsoleApplication2
{
    class Program
    {
        static void Main(string[] args)
        {
            string str = "";

            DateTime begin = DateTime.Now;
            for (int i = 0; i < 10000; ++i)
                str += i;
            DateTime end = DateTime.Now;

            Console.WriteLine(begin - end);
        }
    }
}


分析另一个应用程序:
using System;
using System.Collections.Generic;
using System.Linq;
using System.Text;
using System.Drawing;

namespace ConsoleApplication2
{
    class Program
    {
        static void Main(string[] args)
        {
            int start = Environment.TickCount;
            for (int i = 0; i < 100 * 1000; i++)
            {
                Brush b = new SolidBrush(Color.Black);    // Brush has a finalizer
                string s = new string(' ', i % 37);

                // Do something with the brush and the string.
                // For example, draw the string with this brush - omitted...
            }
            Console.WriteLine("Program ran for {0} seconds",
                              0.001 * (Environment.TickCount - start));
        }
    }
}
这段代码分配了100000个SolidBrush和一些string,导致了总共分配了大约9M内存。通过以下(第一幅是总得,第二副是回收后的)两图比较可以看出最后剩余的内存很大部分是SolidBrush,大部分String对象都被回收。也就是说存活的对象都被提高到更高的代。


通过点击view-》Objects by Address 可以看到对象占用的内存空间。

通过点击view-》timeline 可以看到GC的行为

通过点击view->Call tree ,可以看到finalizers被调用的情况,
