1. 基于python实现随机梯度下降
import matplotlib.pyplot as plt
import numpy as np
def f(x):
"""构造函数"""
#print("calculating f(x) {}".format(x))
return 0.19 * x*x*x - 1.2 * (x*x) - 6 * x + 2.76
def g(x):
"""导数"""
return 0.57 * x * x - 2.4 * x - 6
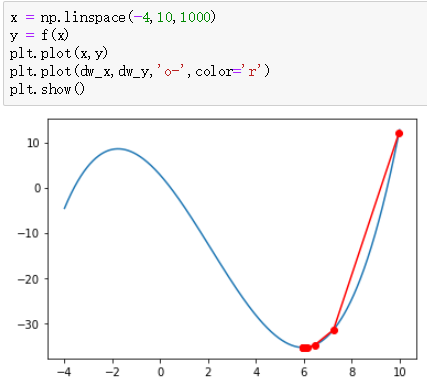
def autoGD(init_x, lr, thresh, epoch):
x = init_x
draw_x,draw_y = [],[]
for i in range(epoch):
grad = g(x)
x = x - lr * grad
print("Epoch {}: x={:.5f} grad={} y={}".format(i,x,grad,f(x)))
if i % 200 == 0:
draw_x.append(x)
draw_y.append(f(x))
if abs(grad) < thresh:
break
return draw_x,draw_y
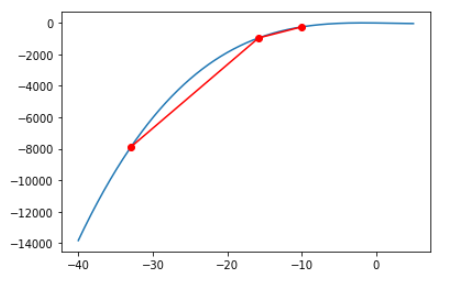
2. 根据输入的任意函数进行随机梯度下降
主要是使用sympy库,具体方法请查看sympy库的API
import numpy as np
import matplotlib.pyplot as plt
import sympy
from sympy import S, Symbol

def f(exp,x):
    return exp.evalf(subs={a:x})

def g(exp,x):
    return sympy.diff(exp,a).evalf(subs={a:x})

def sgd(exp,init_x,lr,thresh,epoch):
    x = init_x
    for i in range(epoch):
        grad = g(exp,x)
        x -= grad * lr
        print("[Epoch : {}] x : {} grad : {}".format(i,x,grad))
        if abs(grad) < thresh:
            break
def draw(exp,begin,end):
    x = np.linspace(begin,end,100)
    y = []
    for ix in x:
        iy = exp.evalf(subs={a:ix})
        y.append(iy)
    plt.plot(x,y)
    plt.show()

def main():
    a = input('请输入变量:')
    b = input('请使用以上变量进行函数式子的表达:')
    a = Symbol(a)
    exp = S(b)
    draw(exp,-5,5)
    sgd(exp,random.randint(0,10),1e-2,1e-3,200)


if __name__ == "__main__":
    main()
