环境
linux: centos7.6
- 公司里最常用的服务器系统
prometheus: 2.13.1.linux-amd64
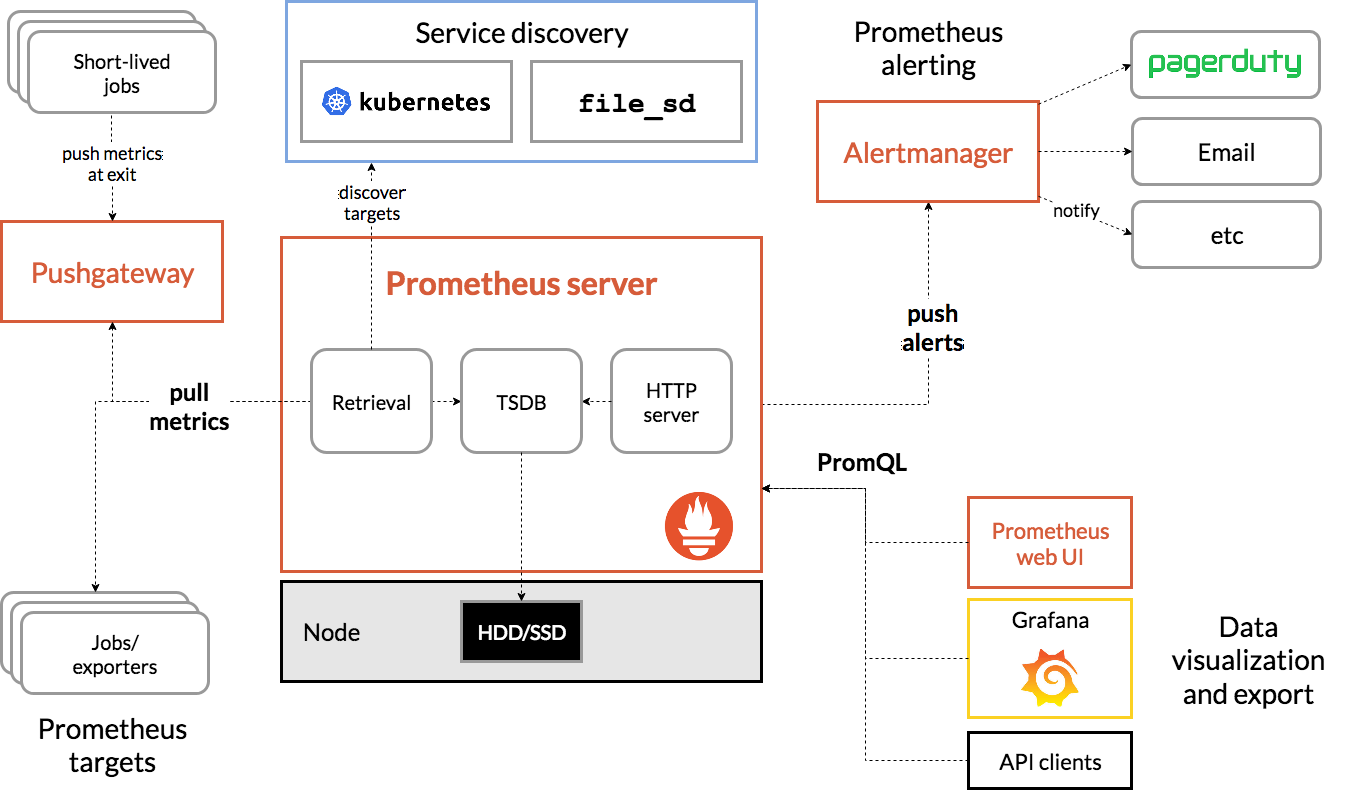
- 基于时间序列的数值数据的容器监控解决方案: 自带了数据存储和监控,是k8s官方指定监控方案。
node_exporter: 0.18.1.linux-amd64
- 用于采集服务器层面的运行指标,然后转为prometheus能够识别的格式,然后建立监听等中央服务主动来抓取数据
process-exporter: 0.5.0.linux-amd64
- 主要用于监控服务进程的,也是将数据转为固定格式,等中央服务器主动来抓取
grafana: 6.4.3.linux-amd64 >>>官方文档https://grafana.com/docs/grafana/latest/
- 一个成熟完整的展示数据的工具,可以整个市场大部分的数据源
准备安装包
prometheus-2.13.1.linux-amd64.tar.gz
process-exporter-0.5.0.linux-amd64.tar.gz
node_exporter-0.18.1.linux-amd64.tar.gz
grafana-6.4.3.linux-amd64.tar.gz
- 本文安装均通过二进制包,解压后直接使用
安装prometheus
下载最新版本,并解压
下载地址:https://prometheus.io/download/
tar xvfz prometheus-*.tar.gz
cd prometheus-*
以下是基本的配置,完整文档介绍可以看 > 官方文档:https://prometheus.io/docs/prometheus/2.13/configuration/configuration/
# my global config
global:
scrape_interval:     15s # Set the scrape interval to every 15 seconds. Default is every 1 minute.
evaluation_interval: 15s # Evaluate rules every 15 seconds. The default is every 1 minute.
# scrape_timeout is set to the global default (10s).

# Alertmanager configuration
alerting:
alertmanagers:
- static_configs:
 - targets:
   # - alertmanager:9093

# Load rules once and periodically evaluate them according to the global 'evaluation_interval'.
rule_files:
# - "first_rules.yml"
# - "second_rules.yml"

# A scrape configuration containing exactly one endpoint to scrape:
# Here it's Prometheus itself.
scrape_configs:
# The job name is added as a label `job=<job_name>` to any timeseries scraped from this config.
- job_name: 'prometheus'

 # metrics_path defaults to '/metrics'
 # scheme defaults to 'http'.

 static_configs:
 - targets: ['localhost:9090']
如果后面配置了exporter组件,可以在scrape_configs里添加job,例如:
scrape_configs:
# The job name is added as a label `job=<job_name>` to any timeseries scraped from this config.
- job_name: 'prometheus'

 # metrics_path defaults to '/metrics'
 # scheme defaults to 'http'.

 static_configs:
 - targets: ['localhost:9090']

- job_name: 'node_exporter'
 static_configs:
 - targets: ['localhost:9100']
启动
# Start Prometheus.
# 默认情况下,Prometheus会将其数据库存储在./data (flag—storage.tsdb.path)中
$ cd prometheus-2.13.1.linux-amd64/
$ nohup ./prometheus --config.file=prometheus.yml >/dev/null &
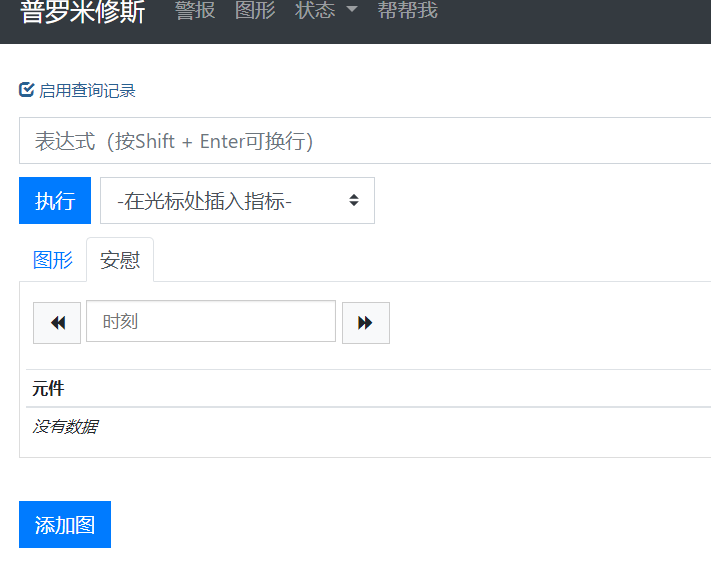
- 验证:可以通过http://ip:9090访问浏览器,或者http://ip:9090/metrics看是否能提供关于自身的各项指标
安装node_exporter
下载二进制安装包,安装并启动
wget https://github.com/prometheus/node_exporter/releases/download/v*/node_exporter-*.*-amd64.tar.gz
tar xvfz node_exporter-*.*-amd64.tar.gz
cd node_exporter-*.*-amd64
nohup ./node_exporter >/dev/null &
- 启动不需要带配置文件,此时服务器会有9100的监听端口。
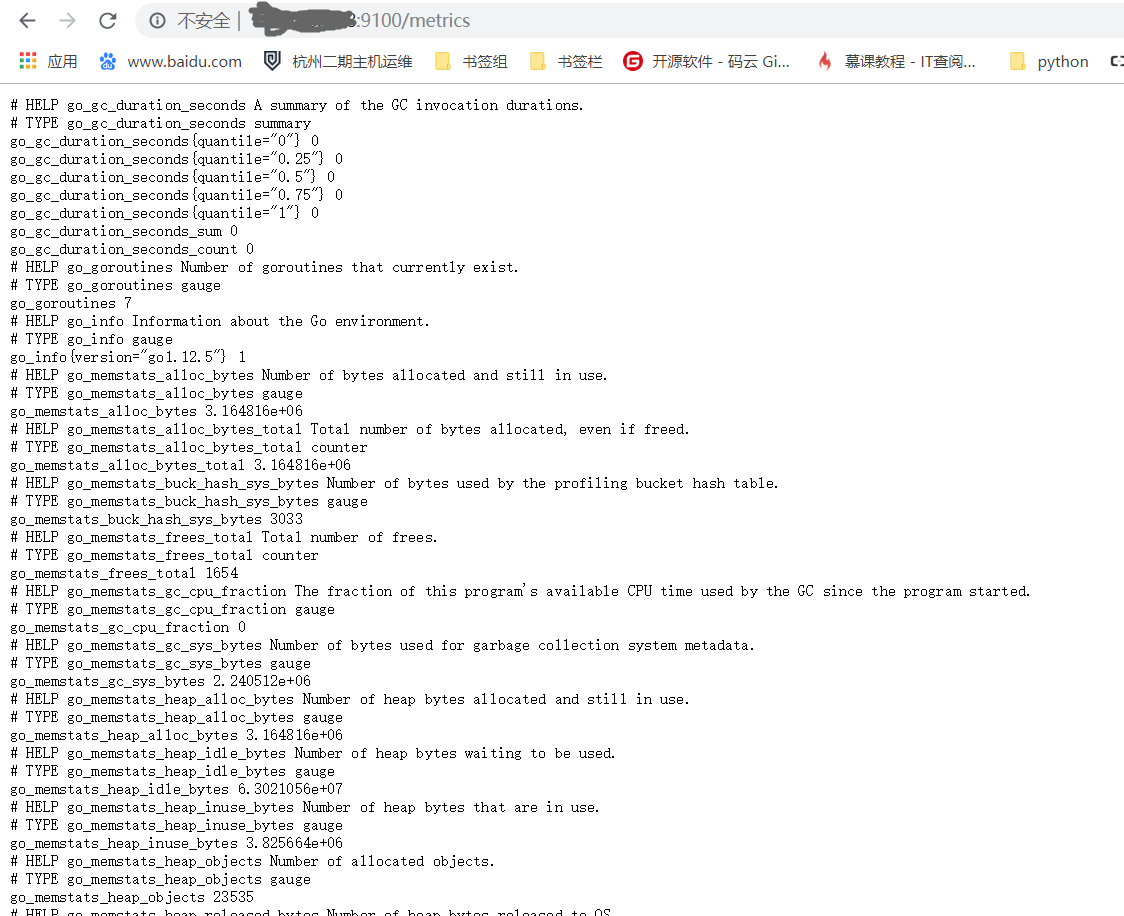
- 验证: 可以通过访问浏览器http://ip:9100/metrics访问服务器运行指标
安装process_exporter
下载二进制安装包
$ wget https://github.com/ncabatoff/process-exporter/releases/download/v0.5.0/process-exporter-0.5.0.linux-amd64.tar.gz
$ tar -xvf  process-exporter-0.5.0.linux-amd64.tar.gz
$ ll
-rw-r--r-- 1 3434 3434    1076 Apr 14  2019 LICENSE
-rwxr-xr-x 1 3434 3434 7681088 Apr 14  2019 process-exporter
-rw-r--r-- 1 3434 3434   12958 Apr 14  2019 README.md
- 这个解压完后默认是没有配置文件的,需要我们自己写一个,启动时通过-config.path 指定配置文件。
读配置文件的本质就是,读里面配置的服务名,通过服务名称去进行pid的查找和分析,以下为范例<这里使用{{.Matches}}模板>匹配mysql和prometheus两个服务:
$ vim process.yaml
process_names:
  - name: "{{.Matches}}"
    cmdline:
    - 'mysqld'

  - name: "{{.Matches}}"
    cmdline:
    - 'prometheus'
启动
# Start process_exporter.
nohup ./process-exporter -config.path process.yaml >/dev/null &
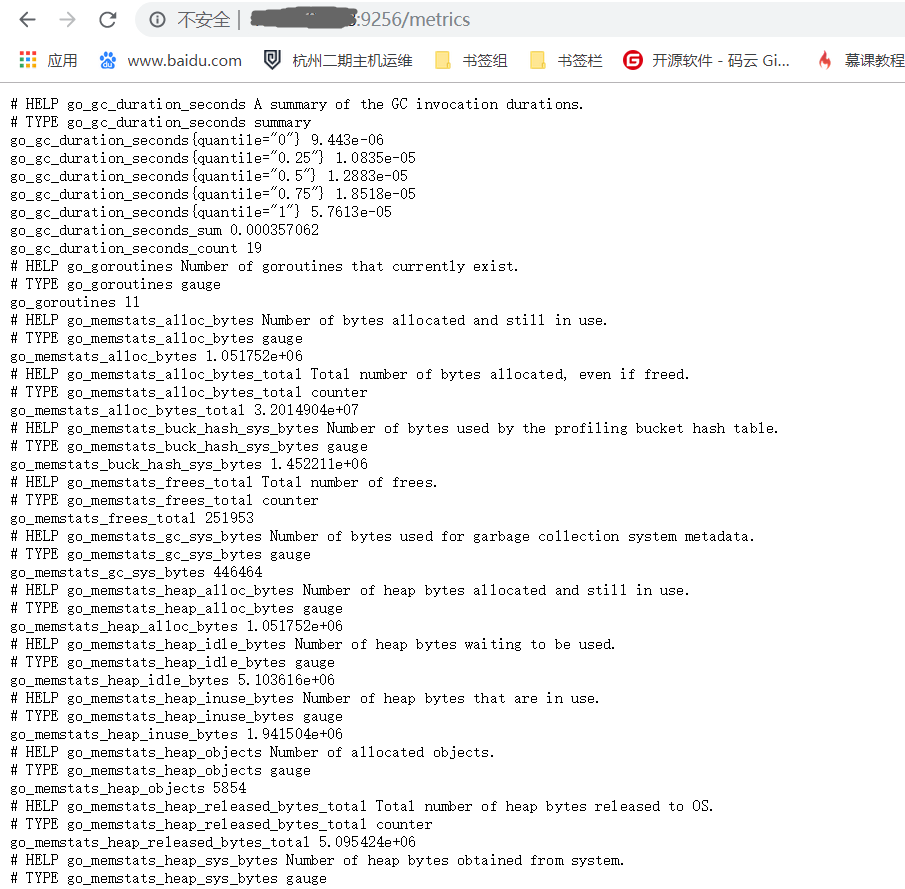
- 验证:访问浏览器http://ip:9256/metrics ,会返回配置文件里指定的服务进程信息
安装grafana
下载二进制安装包
wget https://dl.grafana.com/oss/release/grafana-6.4.3.linux-amd64.tar.gz
tar -zxvf grafana-6.4.3.linux-amd64.tar.gz
启动
- 这里使用官方说明的二进制启动方式,有点忒简单了,正式项目建议都配置为system系统服务
 $ cd grafana-6.4.3
 $ nohup ./bin/grafana-server web >/dev/null &
- 验证:访问浏览器http://ip:3000, 默认的账号密码为: admin / admin

使用grafana配置prometheus数据源
进入grafana管理页面
配置prometheus数据源
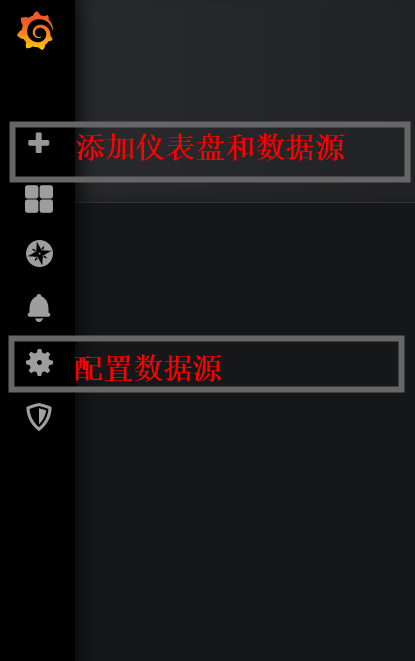
- 点击左边齿轮图标————>> Add data source —————>>点击prometheus

- 拉到最下面点击 Save&Test, 然后再点齿轮就可以看到配置的数据源了
添加仪表盘<可直接看最后一步>
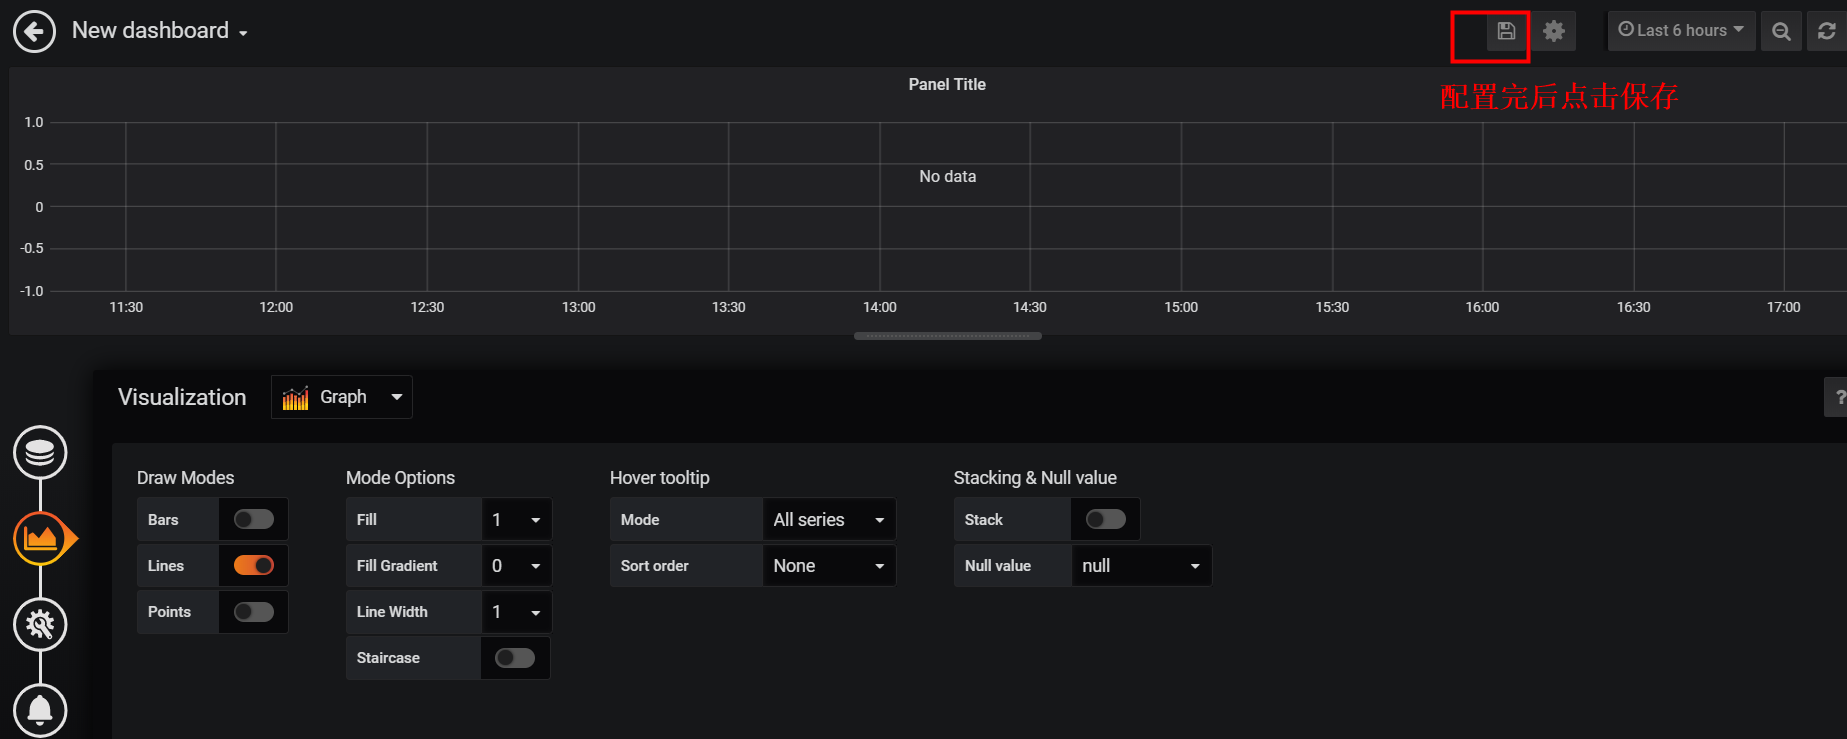
- 点击左边的加号图标————>>点击Choose Visualization(添加仪表盘)
给仪表盘添加数据源<可直接看最后一步>
- 点击左边的方块图标————>>选择刚保存的仪表盘————>>点击仪表盘的Title

使用现有仪表盘模板
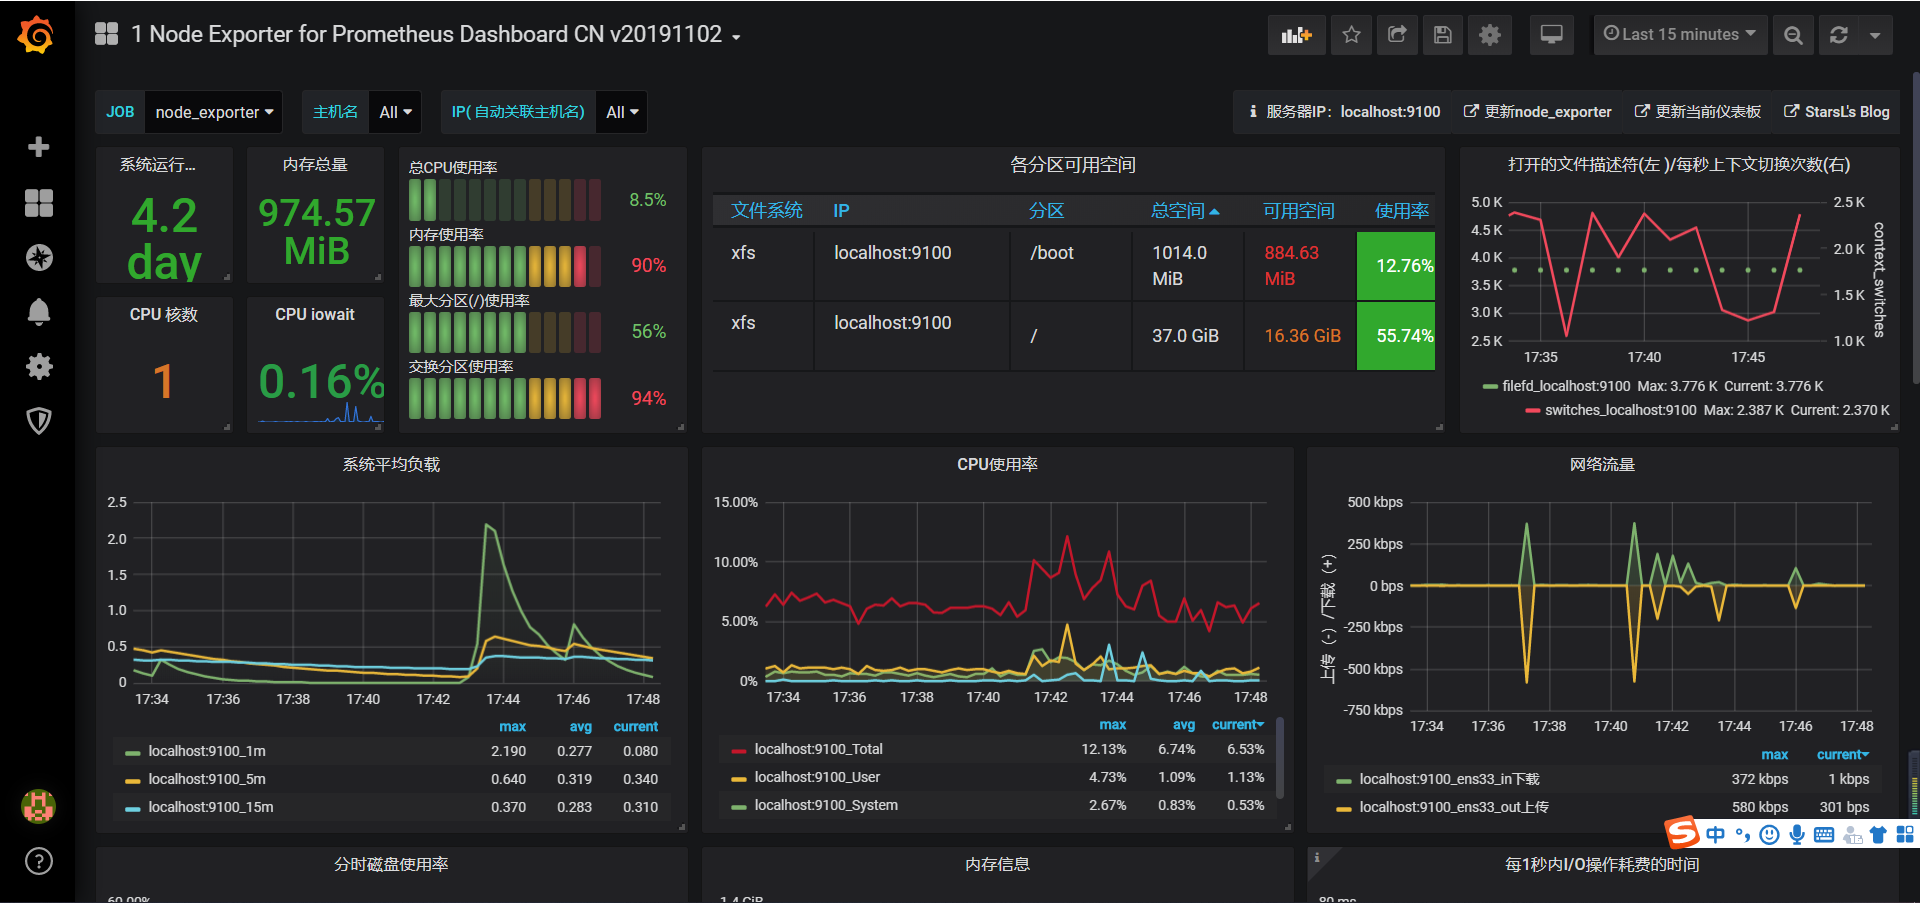
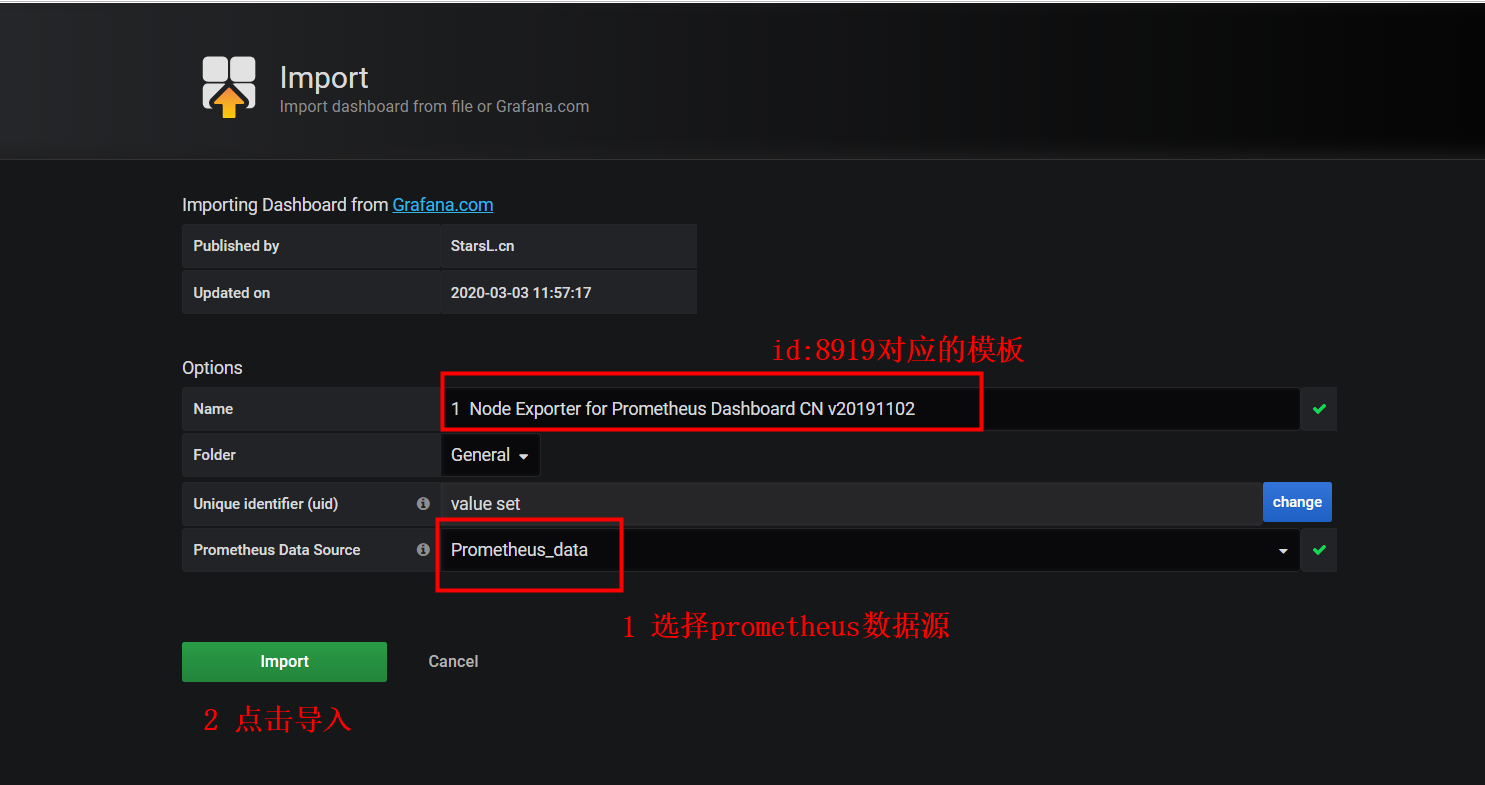
- 点击左边加好图标————>>import————>>在Grafana.com Dashboard中填入8919,然后等待几秒ok
- 最后大功告成