上周20161021-20161028的任务还没有搞完,所以今天来填坑(微笑脸)
××××××××××××××××××××我是萌萌哒分割线×××××××××××××××××××××××××××××××
本文参考:https://bitbucket.org/biobakery/biobakery/wiki/metaphlan2
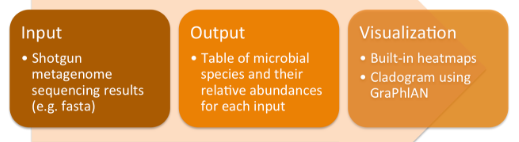
MetaPhlAn2是使用宏基因组鸟枪法测序数据描绘微生物群落组成的工具。
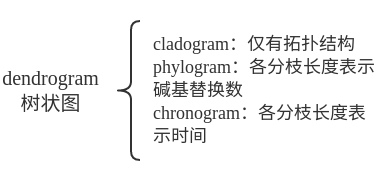
ps: 与系统发育相关的图的表示
安装:
1. 下载并解压 2. 修改/etc/profile,添加路径 3. 直接使用metaphlan2.py
4. 使用这种命令时要给出bowtie2的路径--bowtie2_exe<bowtie2>.
××××××××××××××××××××××××××啦啦啦××××××××××××××××××××××××××××
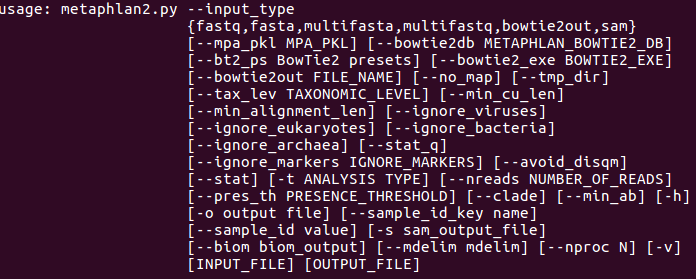
帮助信息:metaphlan2.py -h | less使用上下箭头滚动查看,q退出。
实验内容:
Step 0 : 下载数据(右键,copy link address)
mkdir mytest
cd mytest
wget https://bitbucket.org/biobakery/biobakery/raw/tip/demos/biobakery_demos/data/metaphlan2/input/SRS014459-Stool.fasta.gz
Step 1: 使用单个reads文件作为输入
metaphlan2.py SRS014476-Supragingival_plaque.fasta.gz --input_type fasta > SRS014476-Supragingival_plaque_profile.txt
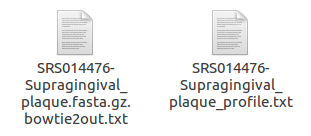
bowtie2out.txt: intermediate mapping results to unique sequence markers
可以用这个命令查看(不过我觉得用gedit也可以啊==除非是命令行)
less -S SRS014476-Supragingival_plaque.fasta.gz.bowtie2out.txt
profile.txt:最终的结果
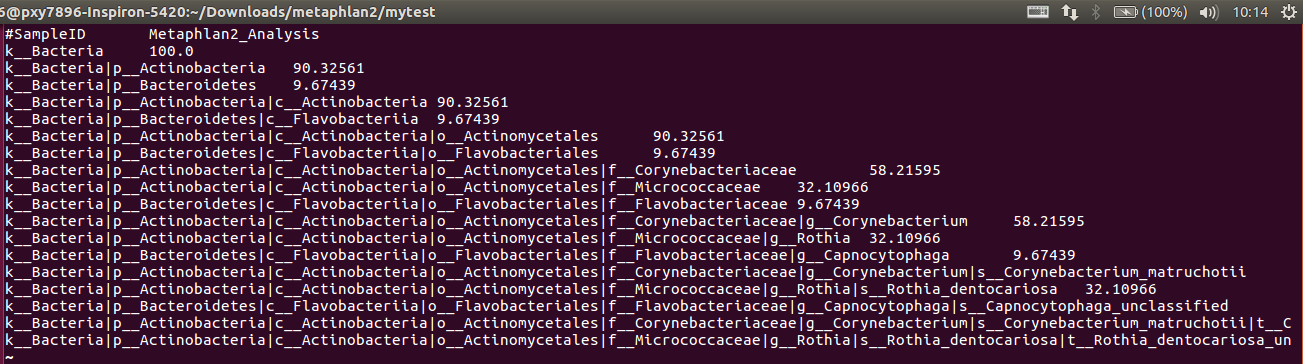
解释:
1. 这就是对分类的描述:Kingdom: k__, Phylum: p__, Class: c__, Order: o__, Family: f__, Genus: g__, Species: s__
2. 数字是百分比
3. OTU equivalents can be extracted by using only the species-level s__ clades from this file (again, making
sure to include clades unclassified at this level).

Step 2: 多线程处理--nproc命令
metaphlan2.py SRS014459-Stool.fasta.gz --input_type fasta --nproc 4 > SRS014459-Stool_profile.txt
Step 3: 多输入处理
for f in *.fasta.gz
do
metaphlan2.py $f --input_type fasta --nproc 4 > ${f%.fasta.gz}_profile.txt
done
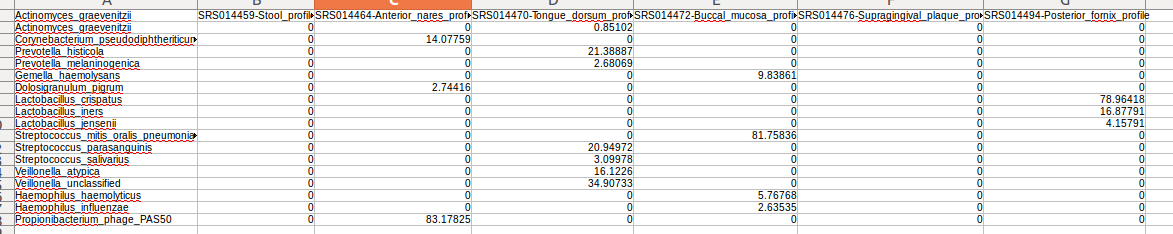
Step 4: 合并结果(使用utils/merge_metaphlan_tables.py脚本)
/home/pxy7896/Downloads/metaphlan2/utils/merge_metaphlan_tables.py *_profile.txt > merged_abundance_table.txt
可以用LibreOffice Calc查看。。。因为数据多,有点丑。大概如下图,前面是分类信息,后面是几个文件的数量信息。

一定要看官方手册!!!!wiki的tutorial虽然好!!!但是!!不全!!MetaPhlAn2也提供了画图的脚本,画出来也挺萌的啊!!!我干嘛要去折腾别的画图!!!
心好累!!!下次再补这个的画图好了,如果用的到的话!!!
https://bitbucket.org/biobakery/metaphlan2#markdown-header-basic-usage
Step 5: 数据可视化,heatmap
(1) 安装brew
sudo apt install linuxbrew-wrapper
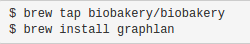
(2) 安装hclust2
brew tap biobakery/biobakery
brew install hclust2
安装失败。。。问题诡异。。。所以我决定先安装R语言包,用里面的函数heatmap什么的来画。
安装R参见:
http://www.cnblogs.com/pxy7896/p/6012895.html
=============================装完R之后再来装就神奇的成功了===================================
(3) 产生物种species丰度表(只有物种层面的)
使用命令:grep -E "(s__)|(^ID)" merged_abundance_table.txt | grep -v "t__" | sed 's/^.*s__//g' > merged_abundance_table_species.txt
命令解释:
1. grep是按指定模式输出的一个软件(库),参考用户手册:http://www.gnu.org/software/grep/manual/grep.pdf
2.

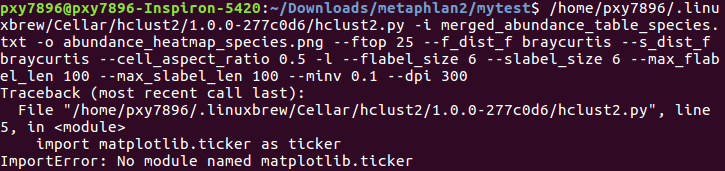
3. 画图
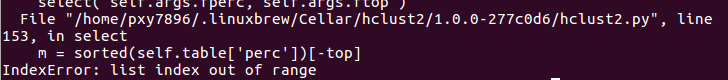
错误1: 找不到.py,加路径:/home/pxy7896/.linuxbrew/Cellar/hclust2/1.0.0-277c0d6
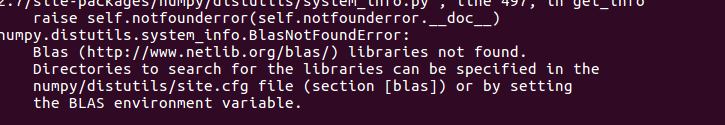
错误2:
安装matplotlib
sudo apt-get install python-matplotlib
然后发现没有scipy。。。同样安装。。
然后发现没有pandas。。。同样安装。。
这个问题。。。我还没解决。。。。
所以直接用官网给的数据吧(输入文件存为test.txt)。。。。感觉这个坑早晚要填。立flag
/home/pxy7896/.linuxbrew/Cellar/hclust2/1.0.0-277c0d6/hclust2.py -i test.txt -o abundance_heatmap_species.png --ftop 25 --f_dist_f braycurtis --s_dist_f braycurtis --cell_aspect_ratio 0.5 -l --flabel_size 6 --slabel_size 6 --max_flabel_len 100 --max_slabel_len 100 --minv 0.1 --dpi 300
参数解释~
select the top 25 features, use Bray-Curtis as the distance measure both between samples and between features (microbes), set the ratio between the width/height of cells to 0.5, use a log scale for assigning heatmap colors, set the sample and feature label size to 6, set the max sample and feature label length to 100, select the minimum value to display as 0.1, and select an image resolution of 300

Step 6: 数据v可视化,GraPhlAn
安装:
(1) 产生输入文件:
/home/pxy7896/.linuxbrew/Cellar/graphlan/0.9.7/bin/export2graphlan.py --skip_rows 1,2 -i merged_abundance_table.txt --tree merged_abundance.tree.txt --annotation merged_abundance.annot.txt --most_abundant 100 --abundance_threshold 1 --least_biomarkers 10 --annotations 5,6 --external_annotations 7 --min_clade_size 1
real奇怪。。。我明明已经改过环境路径了,还是找不到export2graphlan.py(微笑脸)
所以只好写一串了。最后产生

命令解释: skip rows 1 and 2, select the top 100 most abundance clades to highlight, set a minimum abundance threshold for clades to be annotated, extract a minimum of 10 biomarkers, select taxonomic levels 5 and 6 to be annotated within the tree, select taxonomic level 7 to be used in the external legend, and set the minimum size of clades annotated as biomarkers to 1.
(2) 画cladogram
/home/pxy7896/.linuxbrew/Cellar/graphlan/0.9.7/bin/graphlan_annotate.py --annot merged_abundance.annot.txt merged_abundance.tree.txt merged_abundance.xml
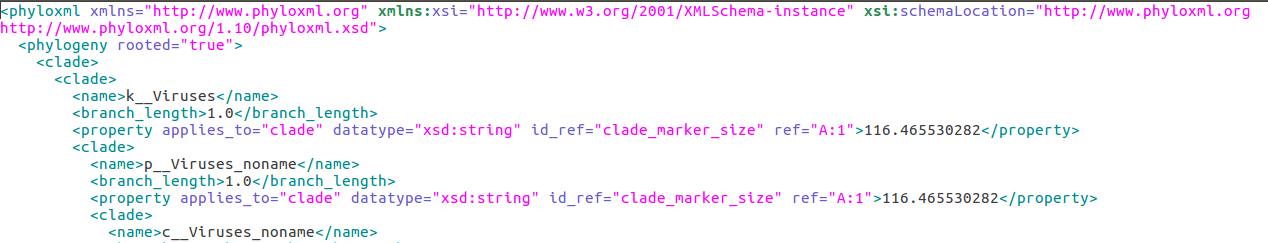
/home/pxy7896/.linuxbrew/Cellar/graphlan/0.9.7/bin/graphlan.py --dpi 300 merged_abundance.xml merged_abundance.png --external_legends
现在就出现了两个说明图片。。。和一张很好看的图~
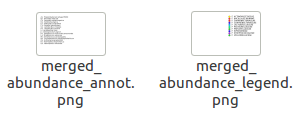

不同颜色表示不同的分组,节点越大,丰度越高,从内而外表示门纲目科属,其中部分biomarker在树图中直接标出,其他的字母所代表的具体物种,在左侧的legend中标出。