1、关于距离的度量
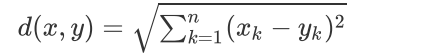
欧式距离
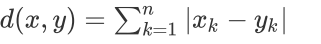
曼哈顿距离
2、算法描述
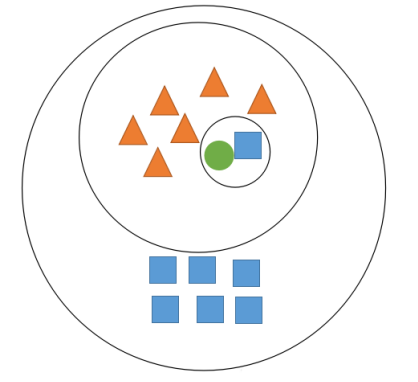
KNN算法,我们给定⼀个数据集,对于⼀个新来到的样本,我们在数据集中找到距离该样本最近的K个样本,在这K个样本中某⼀类出现的次数最多我们就把这个新的样本分到这个类别中。
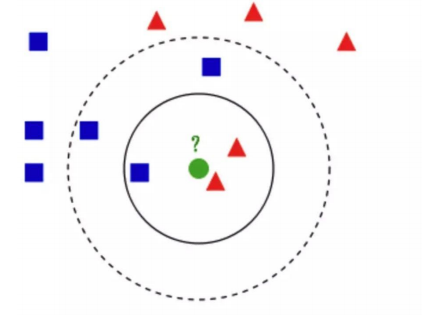
问:绿⾊的圆属于哪⼀类?
3、KNN算法的基本步骤
(1)计算数据集中每个点到测试数据的距离d(i);
(2)将算得的距离d(i)进⾏从⼩到⼤的排序;
(3)根据我们设定的K值选取排序后的前K个点;
(4)确定选取到的K个点中每⼀类别出现的频率;
(5)将出现频率最⾼的⼀类作为测试样本的预测分类结果。
从这个简单的例⼦可以看出,当我们选取不同的K值时会有不同的结果,那我们应该如何去选择K值,⼜应该如去计算数据集中每个样本到新样本之间的距离呢?
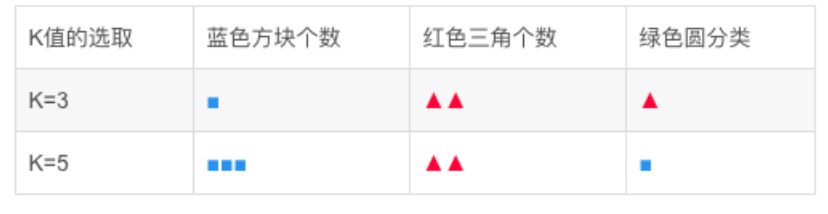
4、K值的选择
KNN中K值的选取对分类的结果影响⾄关重要,K值选取的太⼩,模型太复杂,K值选取的太⼤,导致分类模糊。
举个例⼦
问:绿⾊的圆属于哪⼀类?
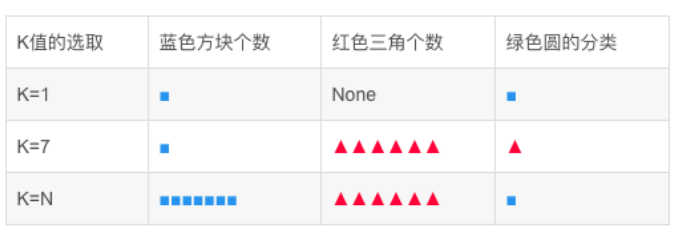
在实际应⽤中,K值⼀般取⼀个⽐较⼩的数值,例如采⽤交叉验证法(简单来说,就是⼀部分样本做训练集,⼀部分做测试集)来选择最优的K值。
import numpy as np
from sklearn.metrics import accuracy_score
from sklearn.neighbors import KNeighborsClassifier
from sklearn.model_selection import train_test_split, cross_val_score
import pandas as pd
import matplotlib.pyplot as plt
def load_data():
 names = ['sepal_length', 'sepal_width', 'petal_length', 'petal_width',
'class']
 # loading training data
 path = 'iris_data.txt'
 df = pd.read_csv(path, header=None, names=names)
 # print df.head()
 x = np.array(df.iloc[:, 0: 4])
 y = np.array(df['class'])
 print (x.shape, y.shape)
 # x_train, x_test, y_train, y_test = train_test_split(x, y,
test_size=0.33, random_state=40)
 return train_test_split(x, y, test_size=0.33, random_state=40)
def predict():
 x_train, x_test, y_train, y_test = load_data()
 k = 5
 knn = KNeighborsClassifier(n_neighbors=k)
 knn.fit(x_train, y_train)
 pred = knn.predict(x_test)
 print (accuracy_score(y_test, pred))
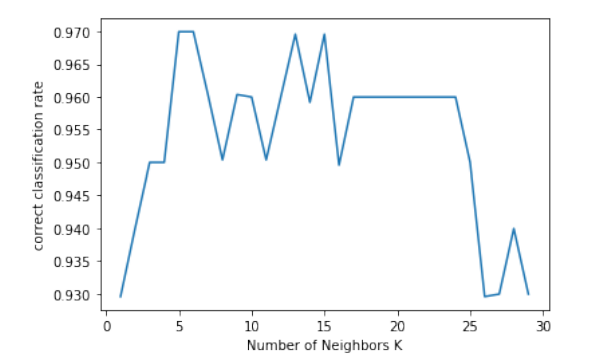
def cross_validation():
 x_train, x_test, y_train, y_test = load_data()
 k_lst = list(range(1, 30))
 lst_scores = []
 for k in k_lst:
 knn = KNeighborsClassifier(n_neighbors=k)
 scores = cross_val_score(knn, x_train, y_train, cv=4,
scoring='accuracy')
 lst_scores.append(scores.mean())
 # changing to misclassification error
 MSE = [1 - x for x in lst_scores]
 optimal_k = k_lst[MSE.index(min(MSE))]
 print ("The optimal number of neighbors is %d" % optimal_k)
 # plot misclassification error vs k
 # plt.plot(k_lst, MSE)
 # plt.ylabel('Misclassification Error')
 plt.plot(k_lst, lst_scores)
 plt.xlabel('Number of Neighbors K')
 plt.ylabel('correct classification rate')
 plt.show()
cross_validation()
predict()
(150, 4) (150,)
The optimal number of neighbors is 5
(150, 4) (150,)
0.94
5、KD树
KD树是⼀种对K维空间中的实例点进⾏存储以便对其进⾏快速检索的树形结构。KD树是⼆叉树,表示对K维空间进⾏划分,构造KD树相当于不断地⽤垂直于坐标轴的超平⾯将K维空间划分,构成⼀些列的K维超矩形区域,KD树的每个节点对应于⼀个K维超矩形区域。
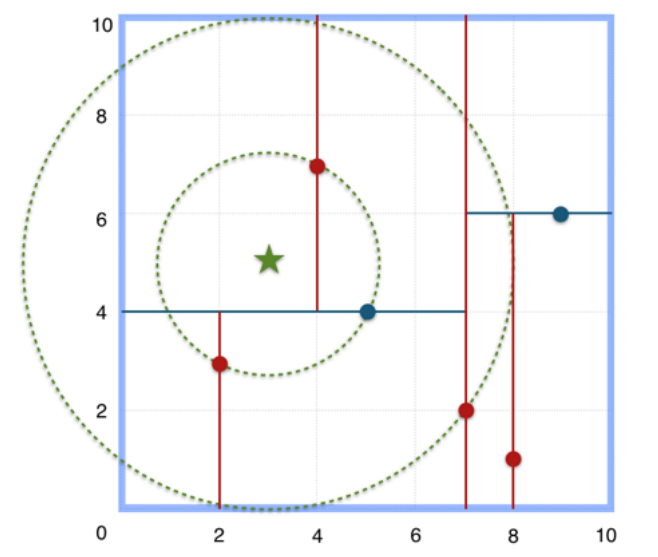
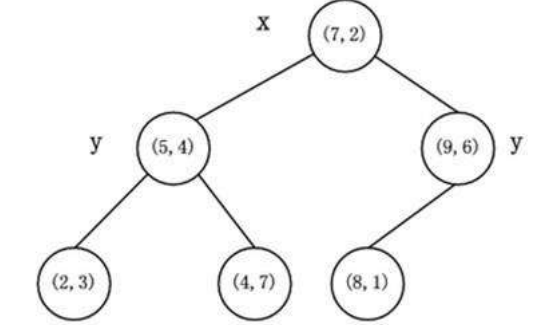
KD树的构建过程举例
给定⼆维空间的数据集:T={(2,3),(5,4),(9,6),(4,7),(8,1),(7,2)},构建⼀个KD树。
(1)找到划分的特征。6个数据点在x,y维度上的数据⽅差分别为6.97,5.37,所以X轴上⽅差更⼤,⽤第⼀维特征建树。
(2)确定划分点(7,2)。根据X维上的值将数据排序,6个数据的中值(奇数个数据的时候为中值,偶数个数据的时候为中值向下取存在的整数)为7,所以划分点的数据是(7,2),此时节点的分割超平⾯就是通过该点并且垂直于X轴,即:直线X=7。
(3)确定左⼦空间和右⼦空间。直线X=7将空间划分为左右:左⼦空间[(2,3),(5,4),(4,7)],右⼦空间[(9,6),(8,1)]。
(4)重复上述⽅法继续划分,直到不能划分为⽌,得到KD树。
KD树
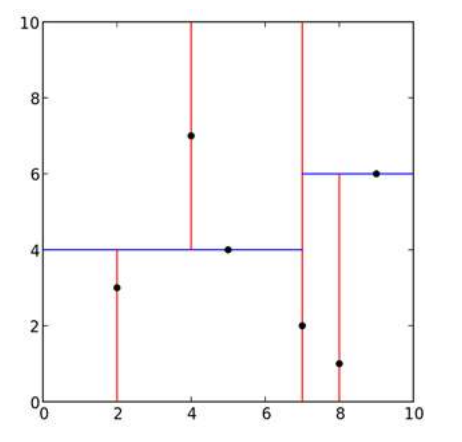
特征空间划分如下
KD树的最近邻搜索