zoukankan      html  css  js  c++  java
  • echarts展示分区数据(x轴数据可以有重复)

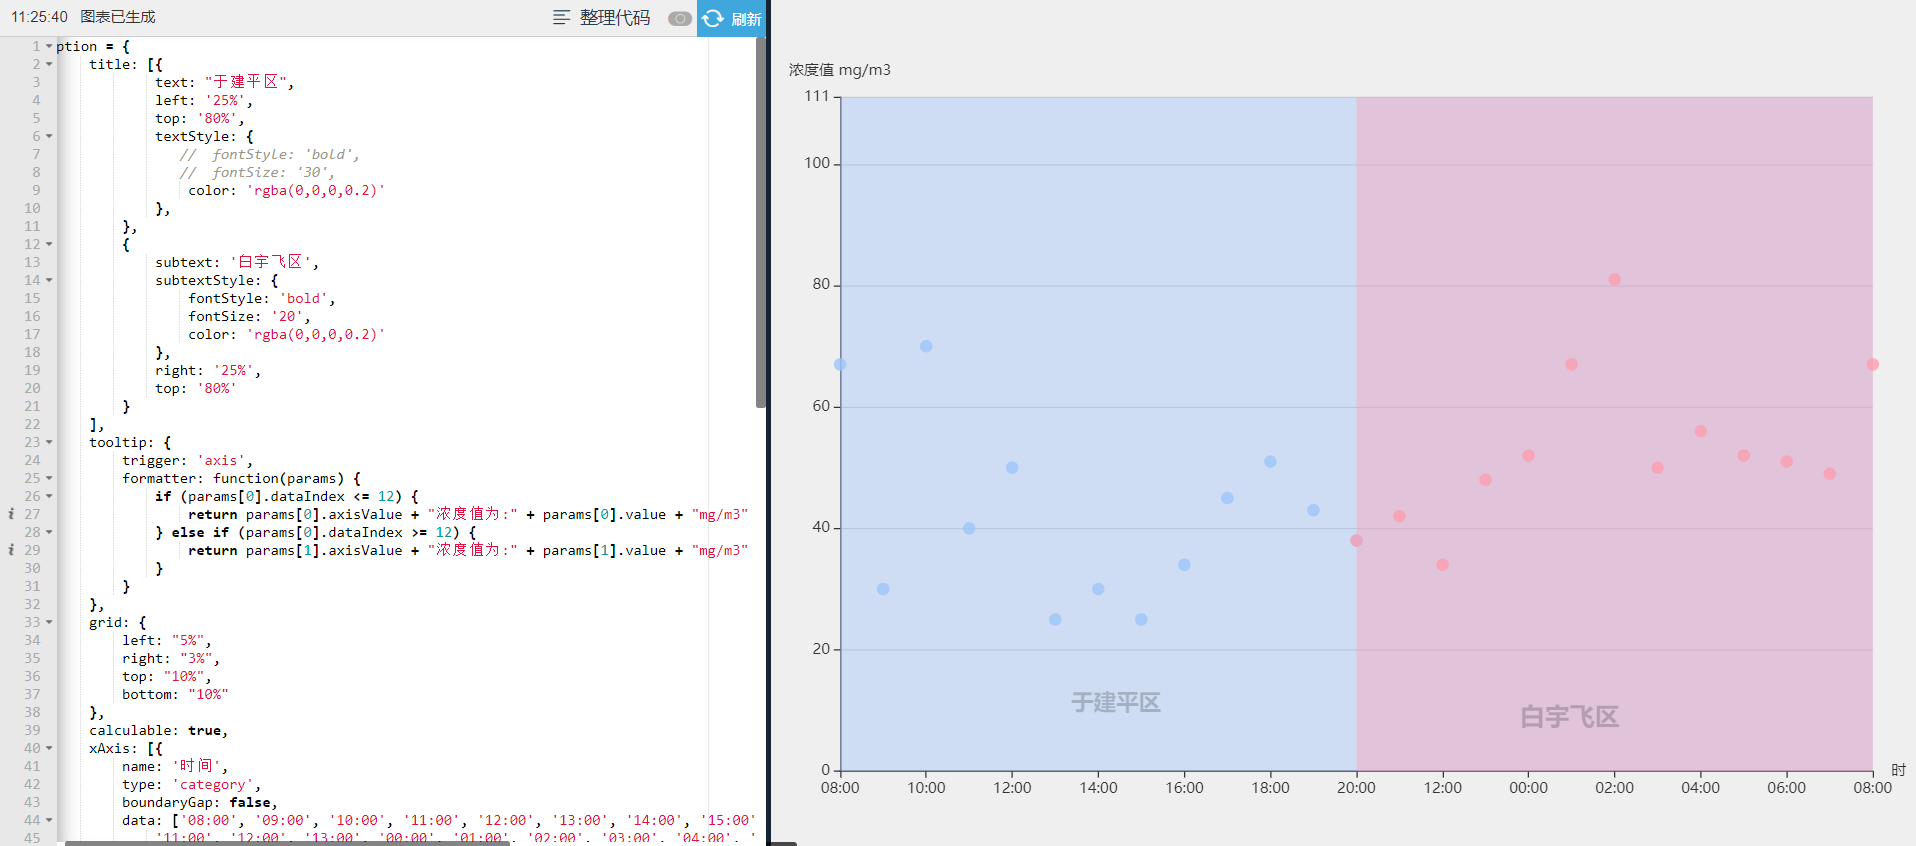
    效果如下:

    代码如下:

     option = {
         title: [{
                 text: "于建平区",
                 left: '25%',
                 top: '80%',
                 textStyle: {
                    //  fontStyle: 'bold',
                    //  fontSize: '30',
                     color: 'rgba(0,0,0,0.2)'
                 },
             },
             {
                 subtext: '白宇飞区',
                 subtextStyle: {
                     fontStyle: 'bold',
                     fontSize: '20',
                     color: 'rgba(0,0,0,0.2)'
                 },
                 right: '25%',
                 top: '80%'
             }
         ],
         tooltip: {
             trigger: 'axis',
             formatter: function(params) {
                 if (params[0].dataIndex <= 12) {
                     return params[0].axisValue + "浓度值为:" + params[0].value + "mg/m3"
                 } else if (params[0].dataIndex >= 12) {
                     return params[1].axisValue + "浓度值为:" + params[1].value + "mg/m3"
                 }
             }
         },
         grid: {
             left: "5%",
             right: "3%",
             top: "10%",
             bottom: "10%"
         },
         calculable: true,
         xAxis: [{
             name: '时间',
             type: 'category',
             boundaryGap: false,
             data: ['08:00', '09:00', '10:00', '11:00', '12:00', '13:00', '14:00', '15:00', '16:00', '17:00', '18:00', '19:00', '20:00',
                 '11:00', '12:00', '13:00', '00:00', '01:00', '02:00', '03:00', '04:00', '05:00', '06:00', '07:00', '08:00'
             ]
         }],
         yAxis: [{
             name: '浓度值 mg/m3',
             type: 'value',
             max: function(value) { //设置y轴最大值
                 return value.max + 30;
             }
         }],
         series: [{
                 type: 'scatter',
                 color: "#9DC4FA", //折线图颜色,搭配markArea为面积图
                 lineStyle: { //折线的颜色
                     color: "#3B9DFC"
                 },
                 smooth: true, //是否平滑处理值0-1,true相当于0.5
                 data: [67, 30, 70, 40, 50, 25, 30, 25, 34, 45, 51, 43, 38,
                     null, null, null, null, null, null, null, null, null, null, null, null
                 ],
                 markArea: {
                     data: [
                         [{
                             xAxis: '08:00'
                         }, {
                             xAxis: '19:59'
                         }]
                     ]
                 }
             },
             {
                 type: 'scatter',
                 color: "#FC9DB2", //折线图颜色,搭配markArea为面积图
                 lineStyle: { //折线的颜色
                     color: "#FA5071"
                 },
                 smooth: true, //是否平滑处理值0-1,true相当于0.5
                 data: [null, null, null, null, null, null, null, null, null, null, null, null, 38,
                     42, 34, 48, 52, 67, 81, 50, 56, 52, 51, 49, 67
                 ],
                 markArea: {
                     data: [
                         [{
                             xAxis: '20:00'
                         }, {
                             xAxis: '08:00'
                         }]
                     ]
                 }
             }
         ]
     };

     markArea参数data的数组每组值可以分别定义name属性及其他属性,以上代码中是在title定义中生效了。

  • 相关阅读:
    C# @符号的多种使用方法
    C#抽象工厂简单实现类
    项目总结——谈谈封装(抽象工厂+反射+缓存机制)
    C#中String类的几个方法(IndexOf、LastIndexOf、Substring)
    String str 与 String str=new String("") 区别
    sql面试题
    [bzoj2038]莫队算法学习
    分治算法初步
    线段树训练
    [poj2104]可持久化线段树入门题(主席树)
  • 原文地址:https://www.cnblogs.com/qtx-/p/11697370.html
Copyright © 2011-2022 走看看