一、ELK搜索引擎原理介绍
在使用搜索引擎是你可能会觉得很简单方便,只需要在搜索栏输入想要的关键字就能显示出想要的结果。但在这简单的操作背后是搜索引擎复杂的逻辑和许多组件协同工作的结果。
搜索引擎的组件一般可分为两大类:索引组件和搜索组件。在搜索之前搜索引擎必须把可搜索的所有数据做整合处理并构建索引(倒排索引),将所有数据构建成能被搜索的格式并存储起来,这就成为索引组件;能根据用户搜索并能从索引组件构建的索引中查询出用户想要的结果的组件称为搜索组件。
ElasticSearch就属于搜索组件的一种,并且它是一个分布式搜索服务器,在搭建ElasticSearch集群时最好有三台以上的服务器,因为它的数据都是分片存储的。Lucene是Apache提供的开源项目,是一个完全用Java编写的搜索引擎库。ElasticSearch使用Lucene作为内部的搜索索引构建库,使ElasticSearch集成了搜索引擎的两大核心组件。虽然用这两个组件可以完成索引构建并进行搜索操作,但成为完善的搜索引擎是不够的。
对于集群日志分析平台来说,还需要对大量应用服务的日志数据进行采集,并按需要的格式进行划分、存储、分析,这就要用到Logstash和Filebeat组件。
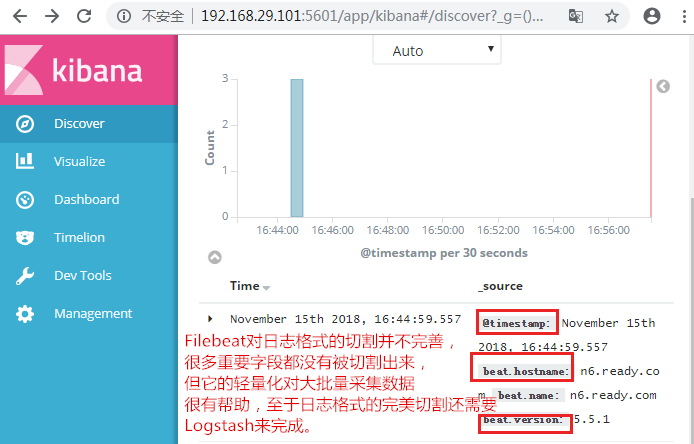
Filebeat是一个非常轻量化的日志采集组件,Filebeat 内置的多种模块(auditd、Apache、NGINX、System 和 MySQL)可实现对常见日志格式的一键收集、解析和可视化。而Logstash是一个开源的服务器端数据处理管道,它可以同时从多个源中提取数据,对其进行转换,然后输出到指定位置。
在解决上面一系列问题后,搜索引擎还需要提供一个友善的用户界面来展示给用户,使用户能够进行傻瓜式的搜索操作,并且还能将搜索结果通过各种直观的方式展示在用户面前。这是就要用到Kibana组件。Kibana可以让ElasticSearch数据极为丰富的展现出来。
上面提到的组件除了Lucene库意外其他的都属于Elastic Stack家族的产品,在普遍的企业中都是采用这些组件构建成集群来分析处理大量的日志数据的。更多组件可访问Elastic官网站点。
二、ELK日志分析集群搭建
1.基本架构
在本文示例中,以下面的结构来进行演示,图1:
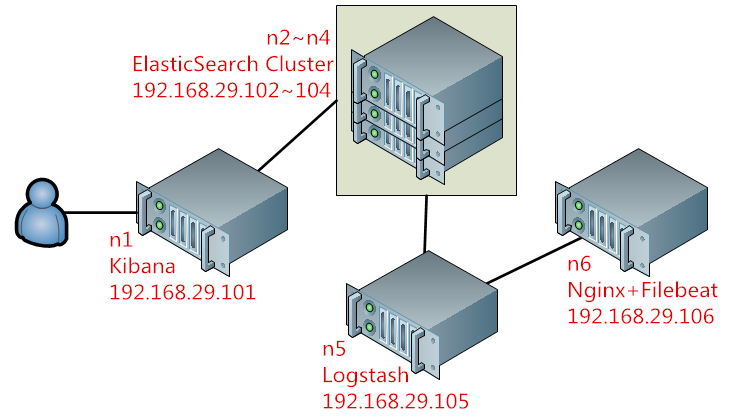
在上图所示的架构的工作逻辑:Kibana将ElasticSearch集群提供的搜索内容进行可视化处理,并用多种方式展现给用户;ElasticSearch集群和其集成的Lucene用来完成对所有采集到的数据进行分析构建索引并提供搜索;而数据的来源则是通过Logstash和FileBeat采集自Nginx日志,Logstash将来自FileBeat的数据过滤并输出给ElasticSearch集群。
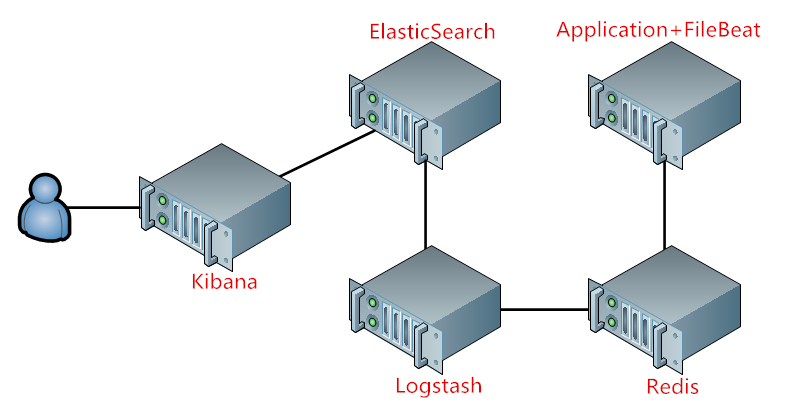
在集群达到一定规模后,大量的后端应用通过FileBeat采集到数据输出到Logstash会使Logstash Server称为性能瓶颈,因为Logstash是用Java程序开发的,很消耗内存,当数据处理量大后性能会大打折扣;所以可以在Logstash和FileBeat之间增加Redis,Redis专门用来做队列数据库,将在FieBeat中采集的数据平缓的输出到Logstash。如图2:
2.搭建ElasticSearch集群
Linux版本:CentOS7.2
ElasticSearch:5.5.1
下面先用图1的架构示例来构建集群,完成后再引入Redis来进行演示,当集群没有达到很庞大规模时引入Redis不会对集群性能有实质性的提升。
由于ElasticSearch是用Java开发的,运行时依赖JDK环境,ElasticSearch集群所有节点上都需要装上JDK。在n2~n4节点上安装ElasticSearch和JDK:
yum install -y java-1.8.0-openjdk java-1.8.0-openjdk-devel
在官网下载ElasticSearch,我这里安装的是ElasticSearch5.5.1版本,在官网下载rpm包直接安装:
rpm -ivh elasticsearch-5.5.1.rpm
ElasticSearch5的程序环境:
1 /etc/elasticsearch/elasticsearch.yml #主程序配置文件
2 /etc/elasticsearch/jvm.options #java配置文件
3 /etc/elasticsearch/log4j2.properties #日志配置文件
主配合文件配置段:
1 Cluster #集群配置段,需要设置ElasticSearch集群名称
2 Node #各节点配置段,要设置当前主机的主机名
3 Paths #各类路径配置段
4 Memory #内存配置段
5 Network #网络配置段
6 Discovery #
7 Gateway
8 Various


 1 # ---------------------------------- Cluster -----------------------------------
 2 #
 3 # Use a descriptive name for your cluster:
 4 #
 5 #cluster.name: my-application
 6 cluster.name: myels #集群名称,ElasticSearch是基于集群名和主机名来识别集群成员的
 7 # ------------------------------------ Node ------------------------------------
 8 #
 9 # Use a descriptive name for the node:
10 #
11 #node.name: node-1
12 node.name: n2 #本节点名
13 # Add custom attributes to the node:
14 #
15 #node.attr.rack: r1
16 #
17 # ----------------------------------- Paths ------------------------------------
18 #
19 # Path to directory where to store the data (separate multiple locations by comma):
20 #
21 #path.data: /path/to/data
22 path.data: /els/data #查询索引数据存放路径
23 # Path to log files:
24 path.data: /els/logs #日志路径
25 #path.logs: /path/to/logs
26 #
27 # ----------------------------------- Memory -----------------------------------
28 #
29 # Lock the memory on startup:
30 #
31 #bootstrap.memory_lock: true #是否开启时就划用所有内存
32 #
33 # Make sure that the heap size is set to about half the memory available
34 # on the system and that the owner of the process is allowed to use this
35 # limit.
36 #
37 # Elasticsearch performs poorly when the system is swapping the memory.
38 #
39 # ---------------------------------- Network -----------------------------------
40 #
41 # Set the bind address to a specific IP (IPv4 or IPv6):
42 #
43 #network.host: 192.168.0.1
44 network.host: 192.168.29.102 #监听地址,默认是本地
45 # Set a custom port for HTTP:
46 #
47 #http.port: 9200 #监听端口
48 #
49 # For more information, consult the network module documentation.
50 #
51 # --------------------------------- Discovery ----------------------------------
52 #
53 # Pass an initial list of hosts to perform discovery when new node is started:
54 # The default list of hosts is ["127.0.0.1", "[::1]"]
55 #
56 discovery.zen.ping.unicast.hosts: ["n2", "n3", "n4"] #为了安全起见,尽量将ElasticSearch节点的解析名配置进来(画圈圈)
57 #
58 # Prevent the "split brain" by configuring the majority of nodes (total number of master-eligible nodes / 2 + 1):
59 #
60 discovery.zen.minimum_master_nodes: 2 #脑裂预防选项
61 #
62 # For more information, consult the zen discovery module documentation.
63 #
64 # ---------------------------------- Gateway -----------------------------------
65 #
66 # Block initial recovery after a full cluster restart until N nodes are started:
67 #
68 #gateway.recover_after_nodes: 3
69 #
70 # For more information, consult the gateway module documentation.
71 #
72 # ---------------------------------- Various -----------------------------------
73 #
74 # Require explicit names when deleting indices:
75 #
76 #action.destructive_requires_name: true
创建数据和日志目录并修改目录权限并启动ElasticSearch:
mkdir -pv /els/{data,logs}
chown -R elasticsearch.elasticsearch /els/
systemctl start elasticsearch
启动时发生了错误:
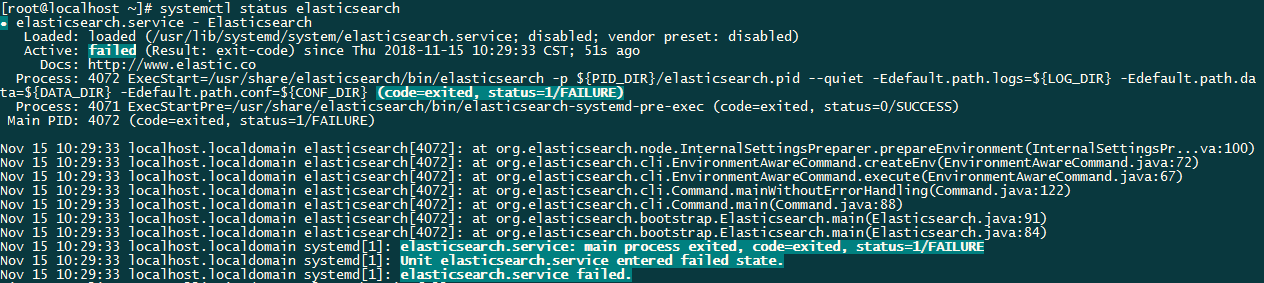
查看 /var/log/messages 发现一条警告信息:
elasticsearch: OpenJDK 64-Bit Server VM warning: If the number of processors is expected to increase from one, then you should configure the number of parallel GC threads appropriately using -XX:ParallelGCThreads=N
这是因为JVM中的 ParallelGCThreads 参数未设置正确导致的,我修改了虚拟机的线程数后又出现了新的报错:
elasticsearch: Exception in thread "main" ElasticsearchParseException[duplicate settings key [path.data] found at line number [36], column number [12], previous value [/els/data], current value [/els/logs]]
这个的大致意思就是路径冲突了,后来发现在主配置文件中我将 path.logs: /els/logs 写成了 path.data: /els/logs ,导致路径冲突。
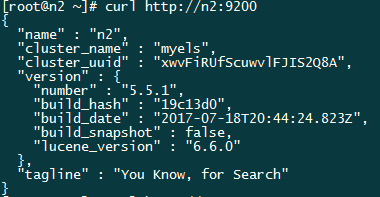
启动完成后可以看到9200和9300端口被监听:

至此ElasticSearch集群就已经工作起来了。
2.安装Kibana
在n1上安装Kibana:
rpm -ivh kibana-5.5.1-x86_64.rpm
修改Kibana配置文件:
vim /etc/kibana/kibana.yml
  1 # Kibana is served by a back end server. This setting specifies the port to use.
  2 #server.port: 5601
  3 server.port: 5601 #监听端口
  4 # Specifies the address to which the Kibana server will bind. IP addresses and host names are both valid values.
  5 # The default is 'localhost', which usually means remote machines will not be able to connect.
  6 # To allow connections from remote users, set this parameter to a non-loopback address.
  7 #server.host: "localhost"
  8 server.host: "192.168.29.101" #监听地址
  9 # Enables you to specify a path to mount Kibana at if you are running behind a proxy. This only affects
 10 # the URLs generated by Kibana, your proxy is expected to remove the basePath value before forwarding requests
 11 # to Kibana. This setting cannot end in a slash.
 12 #server.basePath: ""
 13
 14 # The maximum payload size in bytes for incoming server requests.
 15 #server.maxPayloadBytes: 1048576
 16
 17 # The Kibana server's name.  This is used for display purposes.
 18 #server.name: "your-hostname"
 19 server.name: "n1" #主机名
 20 # The URL of the Elasticsearch instance to use for all your queries.
 21 #elasticsearch.url: "http://n2:9200"
 22 elasticsearch.url: "http://n2:9200" #ElasticSearch地址
 23 # When this setting's value is true Kibana uses the hostname specified in the server.host
 24 # setting. When the value of this setting is false, Kibana uses the hostname of the host
 25 # that connects to this Kibana instance.
 26 #elasticsearch.preserveHost: true
 27
 28 # Kibana uses an index in Elasticsearch to store saved searches, visualizations and
 29 # dashboards. Kibana creates a new index if the index doesn't already exist.
 30 #kibana.index: ".kibana"
 31
 32 # The default application to load.
 33 #kibana.defaultAppId: "discover"
 34
 35 # If your Elasticsearch is protected with basic authentication, these settings provide
 36 # the username and password that the Kibana server uses to perform maintenance on the Kibana
 37 # index at startup. Your Kibana users still need to authenticate with Elasticsearch, which
 38 # is proxied through the Kibana server.
 39 #elasticsearch.username: "user" #可以设置登录认证用户和密码
 40 #elasticsearch.password: "pass"
 41
 42 # Enables SSL and paths to the PEM-format SSL certificate and SSL key files, respectively.
 43 # These settings enable SSL for outgoing requests from the Kibana server to the browser.
 44 #server.ssl.enabled: false
 45 #server.ssl.certificate: /path/to/your/server.crt
 46 #server.ssl.key: /path/to/your/server.key
 47
 48 # Optional settings that provide the paths to the PEM-format SSL certificate and key files.
 49 # These files validate that your Elasticsearch backend uses the same key files.
 50 #elasticsearch.ssl.certificate: /path/to/your/client.crt
 51 #elasticsearch.ssl.key: /path/to/your/client.key
 52
 53 # Optional setting that enables you to specify a path to the PEM file for the certificate
 54 # authority for your Elasticsearch instance.
 55 #elasticsearch.ssl.certificateAuthorities: [ "/path/to/your/CA.pem" ]
 56
 57 # To disregard the validity of SSL certificates, change this setting's value to 'none'.
 58 #elasticsearch.ssl.verificationMode: full
 59
 60 # Time in milliseconds to wait for Elasticsearch to respond to pings. Defaults to the value of
 61 # the elasticsearch.requestTimeout setting.
 62 #elasticsearch.pingTimeout: 1500
 63
 64 # Time in milliseconds to wait for responses from the back end or Elasticsearch. This value
 65 # must be a positive integer.
 66 #elasticsearch.requestTimeout: 30000
 67
 68 # List of Kibana client-side headers to send to Elasticsearch. To send *no* client-side
 69 # headers, set this value to [] (an empty list).
 70 #elasticsearch.requestHeadersWhitelist: [ authorization ]
 71
 72 # Header names and values that are sent to Elasticsearch. Any custom headers cannot be overwritten
 73 # by client-side headers, regardless of the elasticsearch.requestHeadersWhitelist configuration.
 74 #elasticsearch.customHeaders: {}
 75
 76 # Time in milliseconds for Elasticsearch to wait for responses from shards. Set to 0 to disable.
 77 #elasticsearch.shardTimeout: 0
 78
 79 # Time in milliseconds to wait for Elasticsearch at Kibana startup before retrying.
 80 #elasticsearch.startupTimeout: 5000
 81
 82 # Specifies the path where Kibana creates the process ID file.
 83 #pid.file: /var/run/kibana.pid
 84
 85 # Enables you specify a file where Kibana stores log output.
 86 #logging.dest: stdout
 87
 88 # Set the value of this setting to true to suppress all logging output.
 89 #logging.silent: false
 90
 91 # Set the value of this setting to true to suppress all logging output other than error messages.
 92 #logging.quiet: false
 93
 94 # Set the value of this setting to true to log all events, including system usage information
 95 # and all requests.
 96 #logging.verbose: false
 97
 98 # Set the interval in milliseconds to sample system and process performance
 99 # metrics. Minimum is 100ms. Defaults to 5000.
100 #ops.interval: 5000
101
102 # The default locale. This locale can be used in certain circumstances to substitute any missing
103 # translations.
104 #i18n.defaultLocale: "en"
浏览器访问http://192.168.29.101:5601,显示如下,说明Kibana已经安装成功:

3.在n6上安装Nginx和Filebeat
前面已经将ElasticSearch搜索引擎最重要的部分搭建完成了,可以进行搜索和构建索引了。下面来部署数据采集的部分。我这里用Nginx来做演示,用Filebeat将Nginx的日志搜集并输出给ElasticSearch并构建索引提供搜索。
在n6节点安装Nginx和Filebeat:
rpm -ivh filebeat-5.5.1-x86_64.rpm
yum install -y nginx
配置Filebeat并启动:
vim /etc/filebeat/filebeat.yml
  1 #=========================== Filebeat prospectors =============================
  2
  3 filebeat.prospectors:
  4
  5 # Each - is a prospector. Most options can be set at the prospector level, so
  6 # you can use different prospectors for various configurations.
  7 # Below are the prospector specific configurations.
  8
  9 - input_type: log
 10
 11   # Paths that should be crawled and fetched. Glob based paths.
 12   paths:
 13     #- /var/log/*.log
 14     - /var/log/nginx/access.log #指定要采集的日志文件路径
 15     #- c:programdataelasticsearchlogs*
 16
 17   # Exclude lines. A list of regular expressions to match. It drops the lines that are
 18   # matching any regular expression from the list.
 19   #exclude_lines: ["^DBG"]
 20
 21   # Include lines. A list of regular expressions to match. It exports the lines that are
 22   # matching any regular expression from the list.
 23   #include_lines: ["^ERR", "^WARN"]
 24
 25   # Exclude files. A list of regular expressions to match. Filebeat drops the files that
 26   # are matching any regular expression from the list. By default, no files are dropped.
 27   #exclude_files: [".gz$"]
 28
 29   # Optional additional fields. These field can be freely picked
 30   # to add additional information to the crawled log files for filtering
 31   #fields:
 32   #  level: debug
 33   #  review: 1
 34
 35   ### Multiline options
 36
 37   # Mutiline can be used for log messages spanning multiple lines. This is common
 38   # for Java Stack Traces or C-Line Continuation
 39
 40   #multiline.pattern: ^[
 41
 42   # Defines if the pattern set under pattern should be negated or not. Default is false.
 43   #multiline.negate: false
 44
 45   #multiline.match: after
 46
 47
 48 #================================ General =====================================
 49
 50 # The name of the shipper that publishes the network data. It can be used to group
 51 # all the transactions sent by a single shipper in the web interface.
 52 #name:
 53
 54 # The tags of the shipper are included in their own field with each
 55 # transaction published.
 56 #tags: ["service-X", "web-tier"]
 57
 58 # Optional fields that you can specify to add additional information to the
 59 # output.
 60 #fields:
 61 #  env: staging
 62
 63 #================================ Outputs =====================================
 64
 65 # Configure what outputs to use when sending the data collected by the beat.
 66 # Multiple outputs may be used.
 67
 68 #-------------------------- Elasticsearch output ------------------------------
 69 output.elasticsearch:
 70   # Array of hosts to connect to.
 71   hosts: ["n2:9200"] #数据输出到ElasticSearch,填写集群其中的一个即可
 72
 73   # Optional protocol and basic auth credentials.
 74   #protocol: "https"
 75   #username: "elastic"
 76   #password: "changeme"
 77
 78 #----------------------------- Logstash output --------------------------------
 79 #output.logstash:
 80   # The Logstash hosts
 81   #hosts: ["localhost:5044"]
 82
 83   # Optional SSL. By default is off.
 84   # List of root certificates for HTTPS server verifications
 85   #ssl.certificate_authorities: ["/etc/pki/root/ca.pem"]
 86
 87   # Certificate for SSL client authentication
 88   #ssl.certificate: "/etc/pki/client/cert.pem"
 89
 90   # Client Certificate Key
 91   #ssl.key: "/etc/pki/client/cert.key"
 92
 93 #================================ Logging =====================================
 94
 95 # Sets log level. The default log level is info.
 96 # Available log levels are: critical, error, warning, info, debug
 97 #logging.level: debug
 98
 99 # At debug level, you can selectively enable logging only for some components.
100 # To enable all selectors use ["*"]. Examples of other selectors are "beat",
101 # "publish", "service".
102 #logging.selectors: ["*"]
systemctl start filebeat
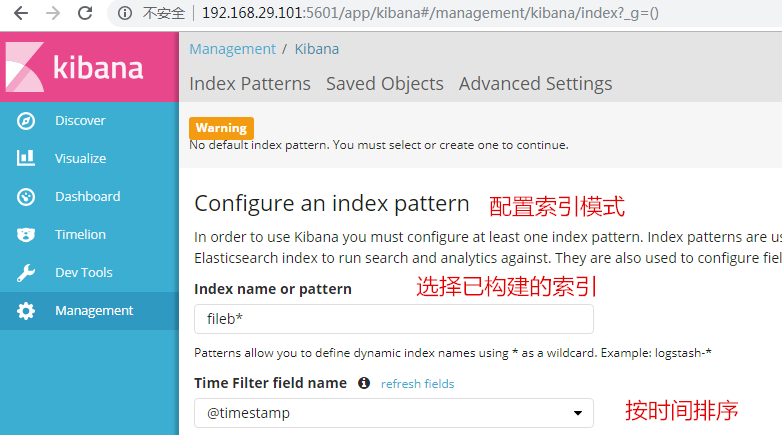
在浏览器上访问n6节点,使Nginx生成日志文件,触发Filebeat将数据输出给ElasticSearch,然后访问n1节点的Kibana,配置索引模式构建索引。在Nginx被访问后会自动生成:
4.安装并配置Logstash
在n5节点上安装Logstash,Logstash的运行依赖JDK环境,所以也需要安装JDK:
yum install -y java-1.8.0-openjdk java-1.8.0-openjdk-devel
rpm -ivh logstash-5.5.1.rpm
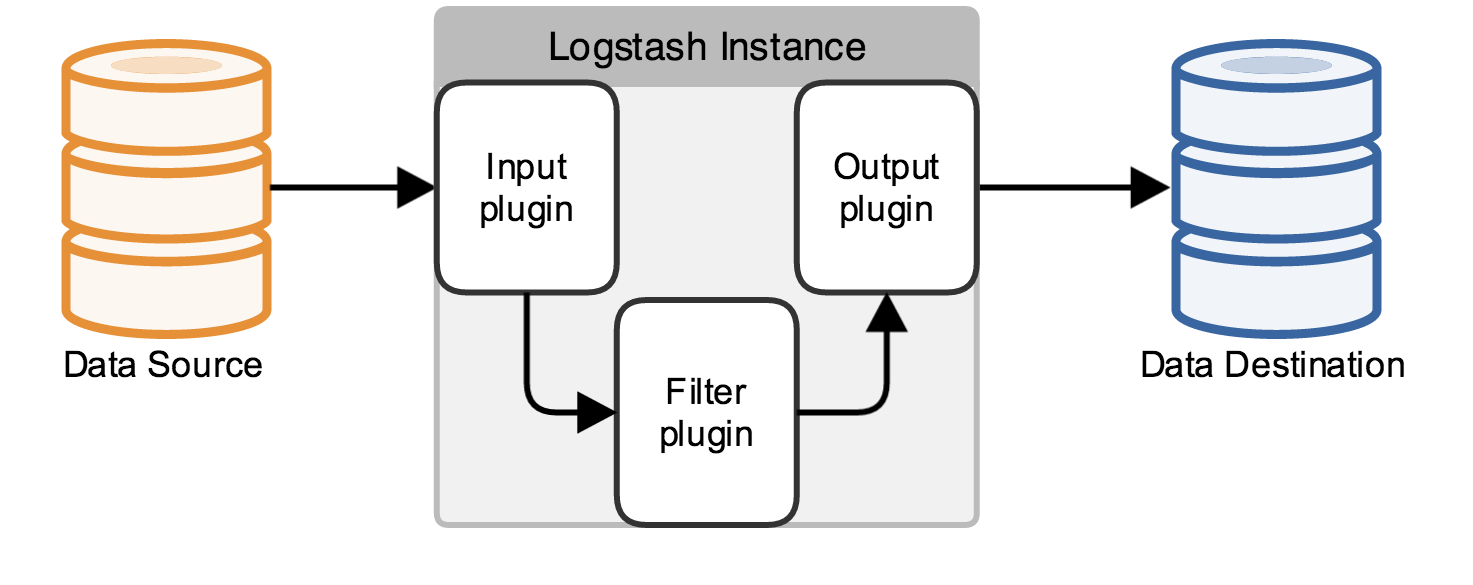
Logstash的组件结构分为输入组件(Input plugin)、输出组件(Output plugin)、过滤组件(Filter plugin),图示:
测试Logstash是否能正常运行时,为避免与root发生权限冲突,需要切换至logstash用户尝试启动Logstash:
su - logstash -s /bin/bash
主配置文件为: /etc/logstash/logstash.yml ,基本上不需要做修改,但要修改n6节点上的Filebeat配置文件,将Filebeat的输出从ElasticSearch修改成向Logstash输出:
#----------------------------- Logstash output --------------------------------
output.logstash:
  # The Logstash hosts
  #hosts: ["localhost:5044"]
  hosts: ["n5:5044"]
在n5节点上编写Logstash过滤模块:
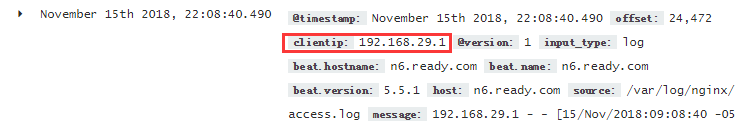
 1 input { #定义数据输入来源,这里定义的是从Filebeat输入
 2         beats {
 3                 host => '0.0.0.0'  #监听地址
 4                 port => 5044
 5                 }
 6 }
 7 filter { #过滤模块,将输入的数据按某种定义的格式做处理切割
 8    grok { #由grok模块来过滤
 9       match => {
10                 "message" => "%{IPORHOST:clientip}" #切割源message的格式
11                 }
12         }
13 }
14
15 output { #将过滤后的数据输出到ElasticSearch
16         elasticsearch {
17                 hosts => ["n2:9200","n2:9200","n2:9200"]
18                 index => "logstash-nginxlog-%{+YYYY.MM.dd}"
19                         }
20 }
在Kibana上重新查找便能看出已经将 clientip 切割出来了,这种的切割功能用Filebeat是没办法实现的: