参考npm文档:https://www.npmjs.com/package/echarts-for-react
由于npm上已经有针对react项目出的echarts插件,所以在这里直接安装
第一步:npm安装echarts-for-react
npm install --save echarts-for-react
npm install echarts --save //如果有报错找不到echarts模块,需要在安装一下exharts'
第二步:引入模块和组件
import echarts from 'echarts'
import echarts from 'echarts/lib/echarts'
<ReactEcharts option={this.getOption()} />
第三步:参考echarts官网实例添加option参数
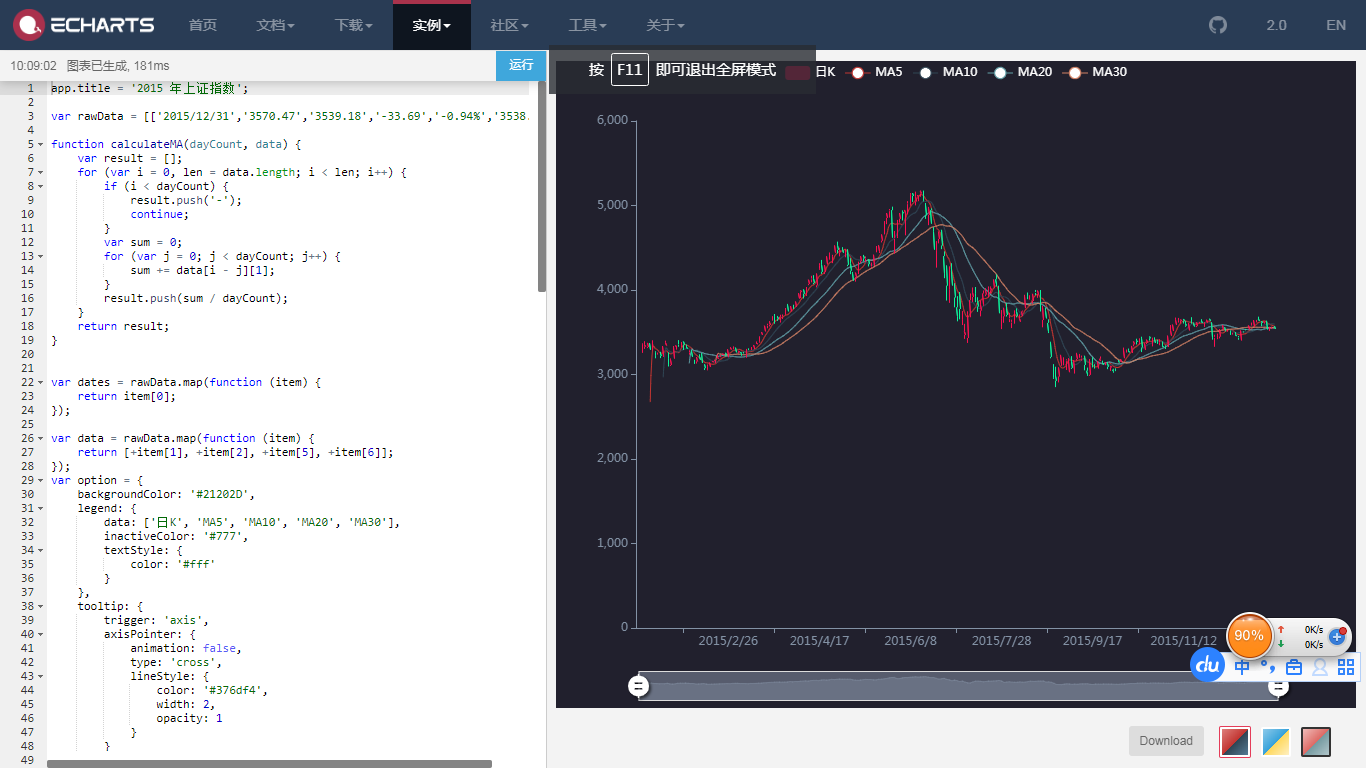
参考官网:https://echarts.baidu.com/examples/
配置 option =>>>
getOption =()=> {
    let option = {
        title:{
          text:'用户骑行订单'
        },
        tooltip:{   //展示数据
          trigger:'axis'
        },
        xAxis:{
          data:['周一','周二','周三','周四','周五','周六','周日']
        },
        yAxis:{
          type:'value'
        },
        series:[
          {
            name:'订单量',
            type:'bar',
            data:[1000,2000,1500,3000,2000,1200,800]
          }
        ]
    }
    return option;
  }
注意:由于引入echarts文件太大,所以一般按需引入,完整项目代码如下:
import React from 'react';
import {Card} from 'antd';
import echartTheme from './../themeLight'
//不是按需加载的话文件太大
//import echarts from 'echarts'
//下面是按需加载
import echarts from 'echarts/lib/echarts'
//导入折线图
import 'echarts/lib/chart/line';  //折线图是line,饼图改为pie,柱形图改为bar
import 'echarts/lib/component/tooltip';
import 'echarts/lib/component/title';
import 'echarts/lib/component/legend';
import 'echarts/lib/component/markPoint';
import ReactEcharts from 'echarts-for-react';
export default class Line extends React.Component{
  componentWillMount(){
    //主题的设置要在willmounted中设置
    echarts.registerTheme('Imooc',echartTheme);
  }
  getOption =()=> {
    let option = {
      title:{
        text:'用户骑行订单',
        x:'center'
      },
      tooltip:{
        trigger:'axis',
      },
      xAxis:{
        data:['周一','周二','周三','周四','周五','周六','周日']
      },
      yAxis:{
        type:'value'
      },
      series:[
        {
          name:'OFO订单量',
          type:'line',   //这块要定义type类型,柱形图是bar,饼图是pie
          data:[1000,2000,1500,3000,2000,1200,800]
        }
      ]
    }
   return option
  }

  render(){
    return(
      <div>
        <Card title="折线图表之一">
            <ReactEcharts option={this.getOption()} theme="Imooc"  style={{height:'400px'}}/>
        </Card>

      </div>
    )
  }
}
注意:按需加载是引入node_modules文件夹中的js文件,所以,如果记得改import 'echarts/lib/chart/line'; 折线图不用改,饼图和柱形图line分别改为pie和bar
可以参考 简书文章 https://www.jianshu.com/p/9d97e5cdf486
