Using Reports(已看)
Using Metrics(已看)
Using CodeCheck for Standards Verification
Running Tools and External Commands
Introduction
What is Understand?
Languages Supported
For Those Who Don't Like to Read Manuals
Parts and Terminology
Using Understand Windows
Understand Terminology
Parts
Starting Understand
Other Ways to Run Understand
Context Menus Are Everywhere
Quickly Find Things in Your Source
Entity Filter
Entity Locator
Instant Search
Find in Files
Favorites
Information Browser
Source Editor
Architecture Browser
Graphical Views
ASCII and HTML Reports
APIs for Custom Reporting
Configuring Your Project
About Understand Projects
The Understand Project Database
Creating a New Project
New Project Wizard
Project Configuration Dialog
Languages Category
Files Category
Adding Directories
Adding Files
Removing Directories and Files
Setting Overrides
Scanning Watched Directories
Setting File Portability
File Types
File Options
Scheduled Activities
Metrics
Metrics->Selected Category
Reports
Reports>Output Category
Reports>Options Category
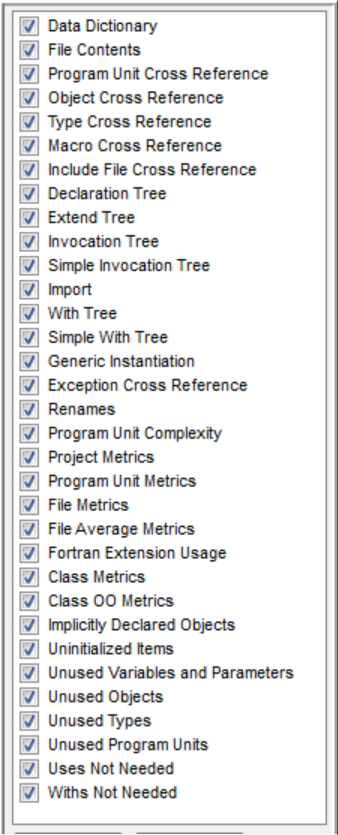
Reports>Selected Category
Visual Studio
CMake
Annotations
Ada Options
Ada>Macros Category
Assembly Options
Visual Basic Options
COBOL Options
COBOL>Copybooks Category
C++ (Fuzzy) Options
C++>Includes Category
C++>Includes>Auto Category
C++>Includes>Ignore Category
C++>Macros Category
C++>Macros>Undefines Category
C++ (Strict) Options
C++(Strict)>Includes Category
C++(Strict)>Includes>Frameworks Category
C++(Strict)>Includes>Prefix Headers Category
C++(Strict)>Macros Category
C# Options
Fortran Options
Fortran>Includes Category
Other Fortran Categories
Java Options
Java>Class Paths Category
Eclipse Plugin
JOVIAL Options
Jovial>!Copy Category
Pascal Options
Pascal>Macros Category
Pascal>Standard Library Paths Category
Pascal>Search Paths Category
PL/M Options
PL/M>Includes Category
Python Options
Python>Imports Category
VHDL Options
Web Options
Setting General Preferences
General Category
User Interface Category
User Interface > Lists Category
User Interface > Alerts Category
User Interface > Windows Category
User Interface > Application Styles Category
Key Bindings Category
Analyze Category
Portability Category
Dependency Category
Editor Category
Editor > Advanced Category
Editor > Macros Category
Editor > Styles Category
Editor > Navigation Category
Editor > External Editor Category
Graphs Category
Analyzing the Code
Improving the Analysis
Using the Missing Header Files Tool
Using the Undefined Macros Tool
Exploring Your Codebase
PLEASE RIGHT-CLICK
Various Windows Explained..
- Entity Filter: Provides an alphabetic list of entities of the selected type.
- Information Browser: Provides an explorer for entity characteristics and connections.
- Project Browser: Lets you browse a hierarchical file list
- Exploring View: Lets you browse a relationship hierarchy.
- Dependency Browser: Lets you browse dependency relationships
- Favorites: Lets you provide quick links to frequently-used entities
- Entity Locator: Lets you filter all entites in a project in complex ways
- Find in Files: Searches multiple files
- Source Editor: Shows source code
- Contextual Information Sidebar: Show context information about the current source editor
- Scope list: Lists the functions or similar constructs in a file.
- Achitectures: Defines named regions and views of the project
- Graphical Views: Shows connections and strctures of entities
- Reports: Generate reports about entities
- Metrics: Generate statistics about entities
Entity Filter
Using the Filter Field
Customizing the Display
Root Filters
- Root Calls: Lists only entities that call others, but are not called themselves. These are either high-level code(mains), code called by hardware(interrupt handlers), or dead(unused) code.
- Root CallBys: Lists only entities that are called by others, but that do not call anybody else. These are low-level routines.
- Root Include Bys: Lists only files included by others, but not included themselves. These are "lower" level include files
- Root Classes: Lists only classes not derived from other classes. These are candicates for lower level classes, or library classes.
- Root Decls: Lists only the highest level declaring routines(Ada)
- Root Withs: Lists only program units(packages, tasks, subprograms) that With other program units, but are not withed by anybody else(Ada)
Information Browser

Drilling Down a Relationship
Displaying More or Less Information
Searching the Information Browser
Syncing the Information Browser
Visiting Source Code
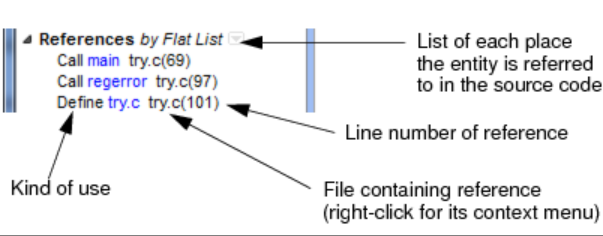
Visiting References
Visiting Metrics
Saving and Printing Information Browser Text
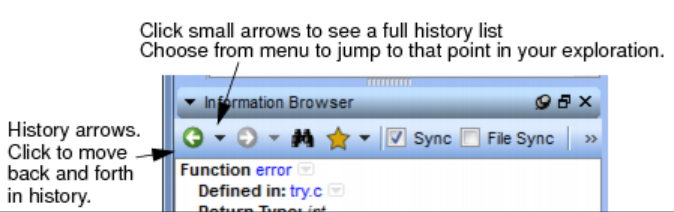
Entity History
Project Browser
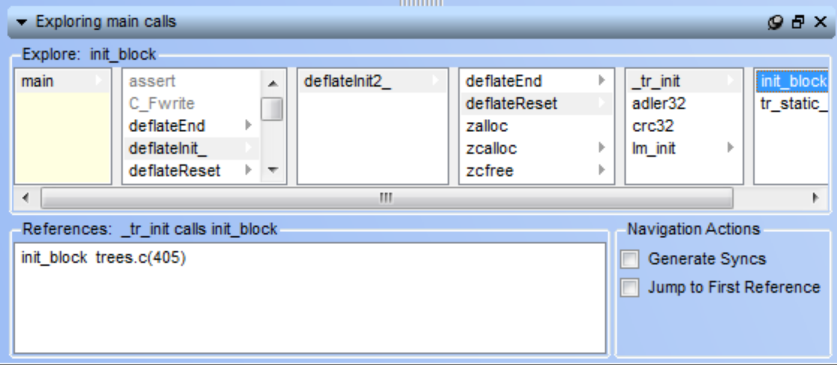
Exploring a Hierarchy
The Exploring view lets you browse up and down a relationship hierarchy within your project
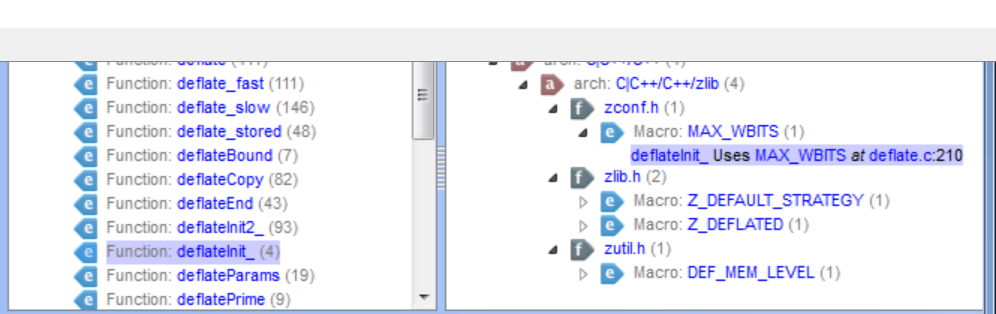
Dependency Browser
The Dependency Browser lets you examine which items are dependent on others. You can use the Dependency Browser with architecture nodes, files, classes, packages, and interfaces
Favorites
Creating a Favorite Entity
Creating a Favorite View
Using a Favorite Group
Creating a Plain Text Favorite
Searching Your Source
Searching: An Overview
Instant Search
Find in Files
Find Results
Replace in Files
Entity Locator
Resizing Columns
Long versus Short Names
Column Headers
Choosing Columns
Filtering the List
Finding Windows
Source Visiting History
View Menu Commands
Displaying Toolbars
Searching in a File
Find Next and Previous
Find & Replace
Contextual Information Sidebar
Editing Your Source
Source Editor
Scope List
Status Icons
Status Line
Selecting and Copying Text
Browse Mode
Context Menu
Hover Text
Saving Source Code
Refactoring Tools
Renaming Entities
Inlining Functions
Extracting Functions
Inline Temp
Extract Temp
Other Editing Features
Previewer
Bracket Matching
Folding and Hiding
Splitting the Editor Window
Commenting and Uncommenting
Changing Case
Indentation
Line Wrapping
Insert and Overtype Modes
Sorting Lines Alphabetically
Keyboard Commands
Recording, Playing, and Saving Macros
Creating and Opening Files
Bookmarking
Managing Source Editor Tabs
Changing the Source Code Font Size
Annotations
Adding an Annotation
Editing an Annotation
Deleting an Annotation
Managing Annotations Files and Display
Searching Annotations
Filtering Annotations
Managing Orphaned Annotations
Printing Souce Views
Architecting Your Codebase
About Architectures
Using the Architecture Browser
Exploring Architectures
Viewing Architecture Dependency Graphs
Graphic Customizer Toolbar
Graph Architecture View
Viewing Architecture Metrics
Managing Architectures
Creating an Architecture
Using the Architecture Wizard
Editing an Architecture
Using XML to Manage Architectures
Exporting Architectures to XML
Importing XML Architecture
Using Reports
Configuring Reports
Customizing Report Colors
Generating Reports
Viewing Reports
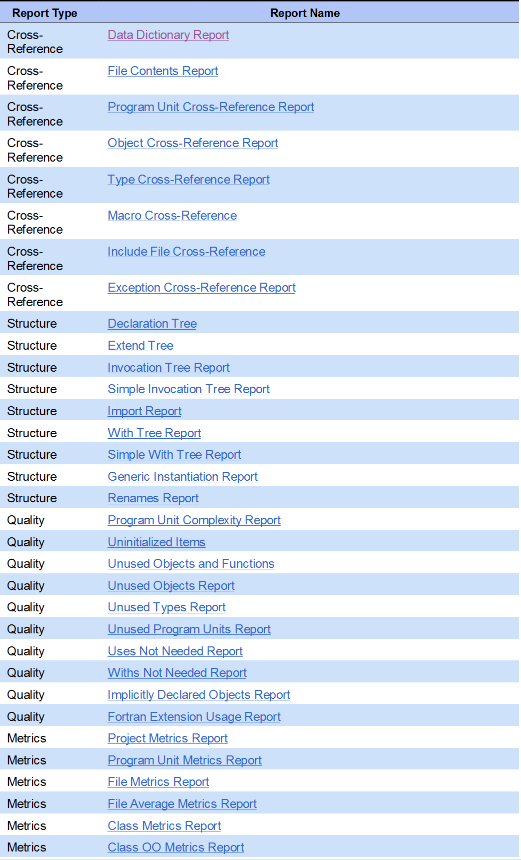
And Overview of Report Categories
- Cross-Reference reports show information similar to that in the Information Browser, except that all entities are shown together in alphabetic order.
- Structure reports show the structure of the analyzed program
- Quality reports show areas where code might need to be examined
- Metrics reports show basic metrics such as the number of lines of code adn comments
Augmnet with the PERL or C API
Cross-Reference Reports
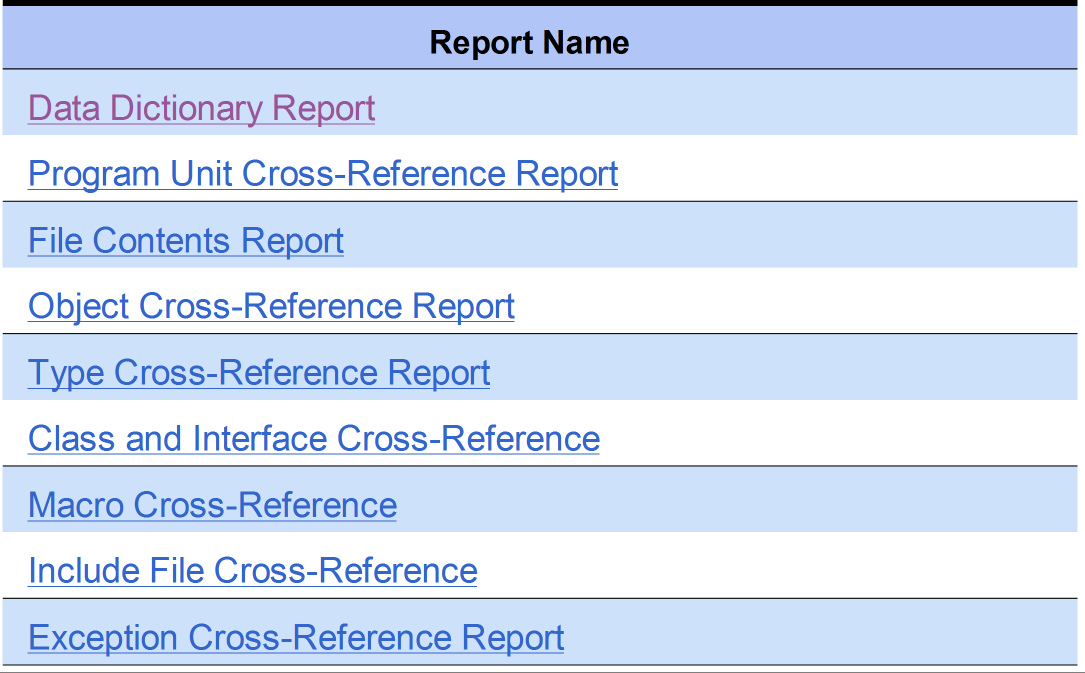
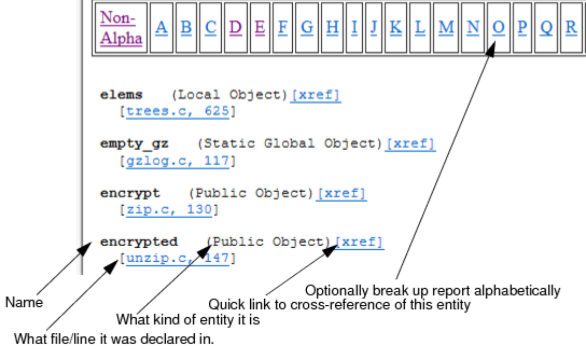
Data Dictionary Report
The Data Dictionary Report lists all entities alphabetically. Each listing shows the entity name, what kind of entity it is (for example, macro, type, variable, function, include, file, or procedure), along with links to the location where each is declared in the source code.
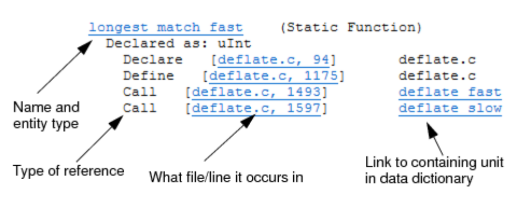
Program Unit Cross-Refernece Report
The Program Unit Cross-Reference Report lists all program units (such as procedure and functions) analyzed in alphabetic order along with information about what they return (if anything), what parameters are used, and where they are used by other program units.
File Contents Report
Lists functions declared within a source file and the line numbers where they are declared

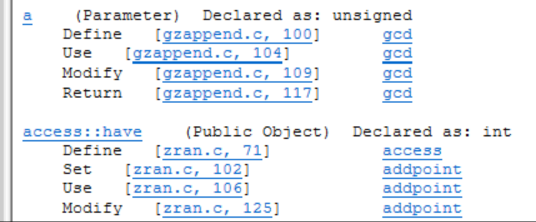
Object Cross-Reference Report
The Object Cross-Refernece Report lists all objects(Fortran variables, parameters, macros) in alphabetic order along with declaration and usage references.
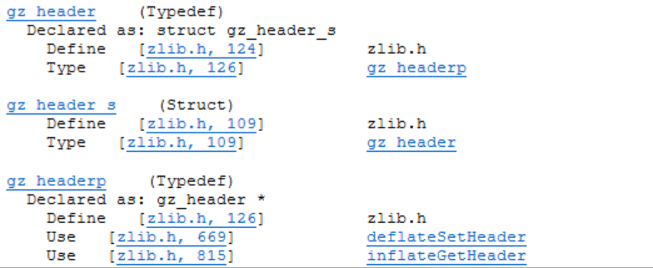
Type Cross-Reference Report
The Type Cross-Reference Report lists all declared types in alphabetic order, along with their declaration and usage information
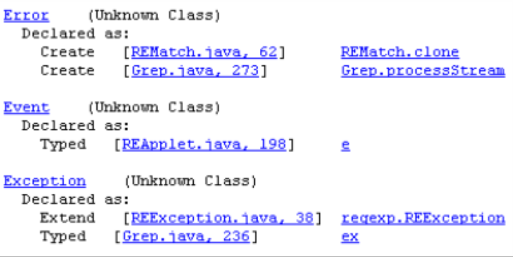
Class and Interface Cross-Reference
The Class and Interface Cross-Reference Report lists all declared classes and interfaces in alphabetic order, along with their declaration and usage information
Macro Cross-Reference
The Macro Cross-Reference Report lists all macros analyzed in the source code in alphabetic order along with information about where they are declared and where they are used

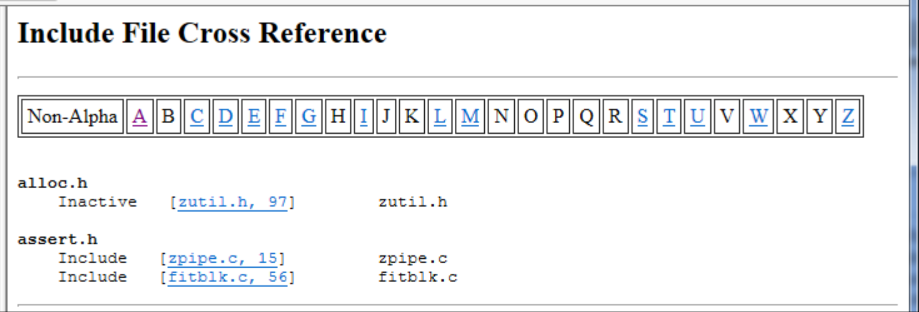
Include File Cross-Reference
The Include File Cross-Reference Report lists all include files analyzed in the source code in alphabetic order with information about which files include them.
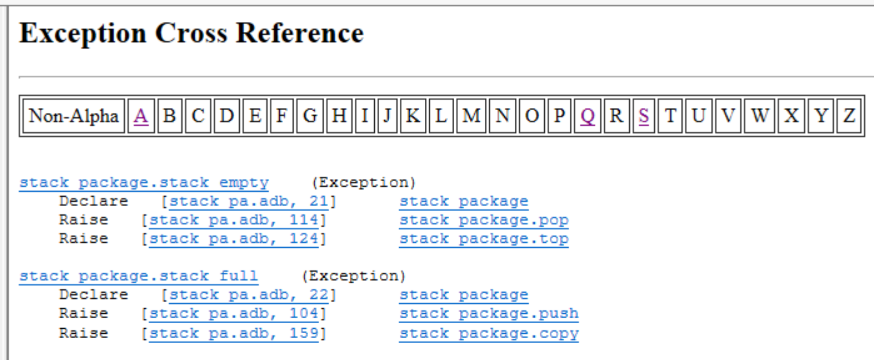
Exception Cross-Reference Report
The Exception Cross-Reference Report documents the declaration and usage of all exceptions. Each declaration and any raises or handles are documented
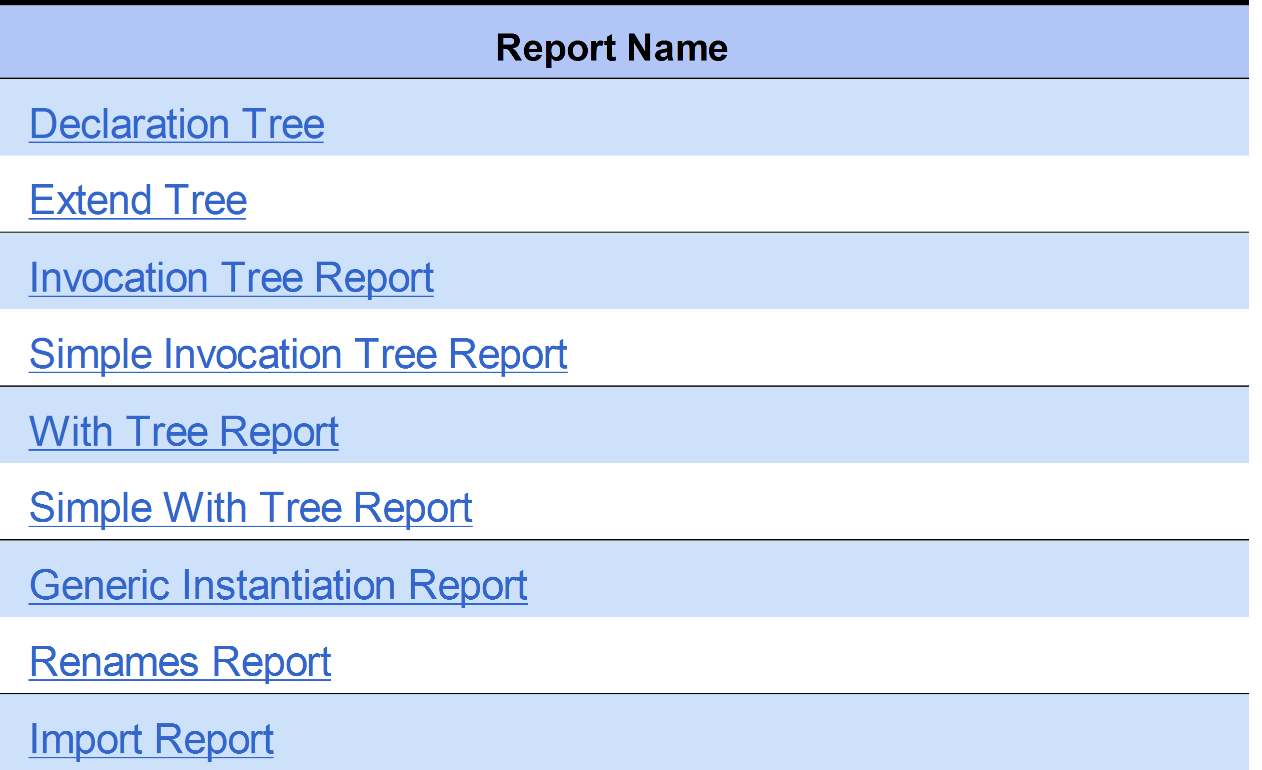
Structure Reports
Structures reports are designed to help you understand the relationships between various entities.
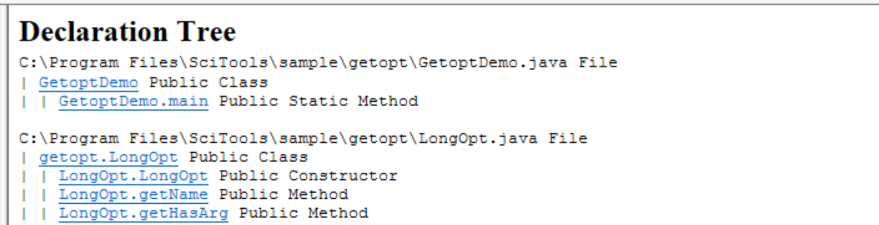
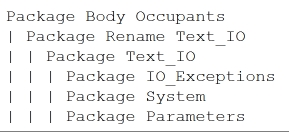
Declaration Tree
The Declaration Tree shows the declaration nesting of each program unit analyzed. Each nesting level is indicated by an indent with a vertical bar used to help align your eyes when viewing. Each nesting level is read as "declares"
Extend Tree
The Extend Tree reports shows the nesting of class declarations in the files analyzed. Each nesting level is indicated by an indent with a vertical bar to help align your eyes when viewing. Each nesting level is read as "extends"
Invocation Tree Report
The Invocation Tree Reports shows a textual representing of the invocation tree for each program unit analyzed. The report shows what each program unit calls.Levels are indicated by tabs and are lined up vertical bars.Each nesting level is read as "calls"

Simple Invocation Tree Report
The Simple Invocation Tree Report shows the invocation tree to only one level for each program unit that has been analyzed. The invocation level is indicated by an indent and a vertical bar and is read as "calls"

With Tree Report
Structured identically to the other hierarchy reports, the With Tree report shows a textual version of the With Tree for each program unit that is not Withed by another.
Simple With Tree Report
The Simple With Tree report is similar to the With Tree report. It shows a textual representation of the With Tree for each program unit that is not Withed by another. However, it shows only one level of withs.
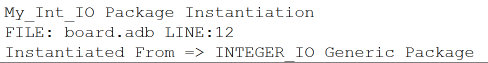
Generic Instantiation Report
This report lists each package that was created through instantiation
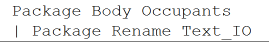
Renames Report
The Rename Report cross-references the use of the Ada command "renames", as in:

This report lists program units that have been renamed in alphabetic order.
Import Report
The Imports report lists all source files that import other files and the files they import.
Quality Reports
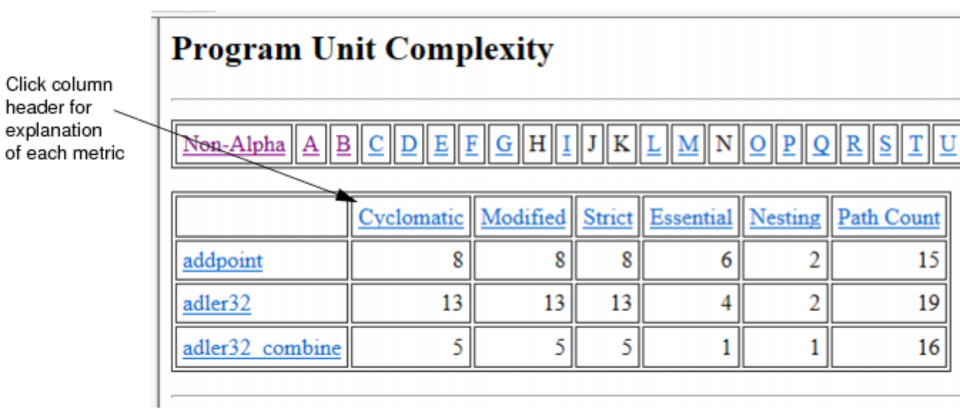
Program Unit Complexity Reports
The Program Unit Complexity Report lists every procedure and function or similar program unit in alphabetic order along with the McCabe(Cyclomatic) complexity value for the code implementing that program unit.
- The Cyclomatic complexity is the number of independent paths through a module. The higher this metric the more likely a program unit is to be difficult to teset and maitain wiithout error
- The Modified column shows the cyclomatic complexity except that each case statement is not counted; the entire switch counts as 1
- The Strict column shows the cyclomatic complexity except && and || also count as 1
- The Nesting column shows the maximum nesting level of control constructs in this program unit.
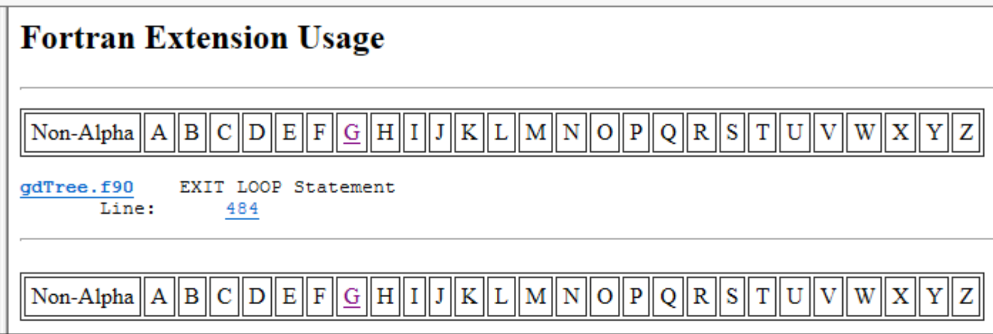
Fortran Extension Usage Report
This report lists anywhere your source code has non-standard Fortran extension. The report factors in what variant (F77, F90, F95) you chose on your project configuration
Implicitly Declared Objects Report
Uninitialized Items
Unused Objects and Functions
Unused Objects Report
Unused Types Report
Unused Program Units Report
Uses Not Needed Report
Withs Not Needed Report
Metrics Reports
Metrics provide statistical information about your project and entities, such as the number of lines of code and the complexity of various entities.

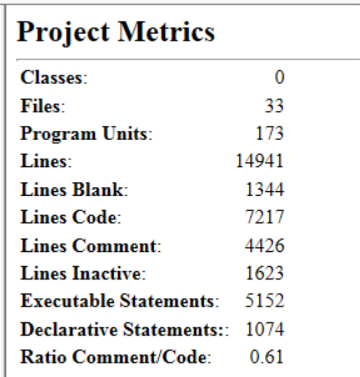
Project Metrics Report
The Project Metrics Report provides metric information about the entire project
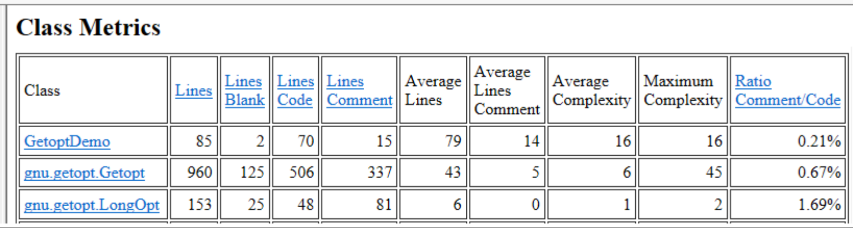
Class Metrics Report
The Class Metrcis Report provides the following metrics for each class that has been analyzed.
Class OOMetrics Report
The Class OO Metrics Report provides the following object-oriented metrics for each class that has been analyzed:
- LCOM (Percent Lack of Cohesion): 100% minus the average cohesion for class data memebers. A method is cohesive when it performs a single task
- DIT (Max Inheritance Tree): Maximum depth of the class in the inheritance tree.
- IFANIN (Count of Base Classes): Number of immediate base classes.
- CBO (Count of Coupled Classes): Number of other classes coupled to this class.
- NOC (Count of Derived Classes): Number of immediate subclasses this class has.
- RFC (Count of All Methods): Number of methods this class has, including inherited methods.
- NIM (Count of Instance Methods): Number of instance methods this class has.
- NIV (Count of Instance Variables): Number of instance variables this class has.
- WMC (Count of Methods): Number of local methods this class has.
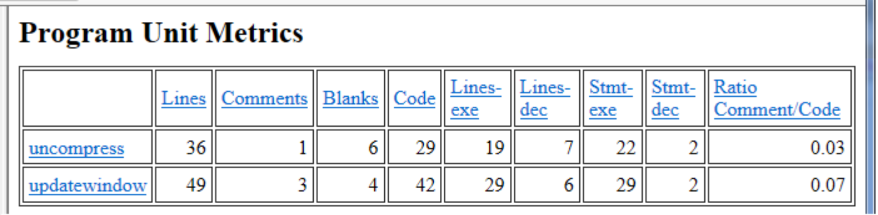
Program Unit Metrics Report
The Program Unit Metrices Report provides information on various metrics for each program unit that has been analyzed
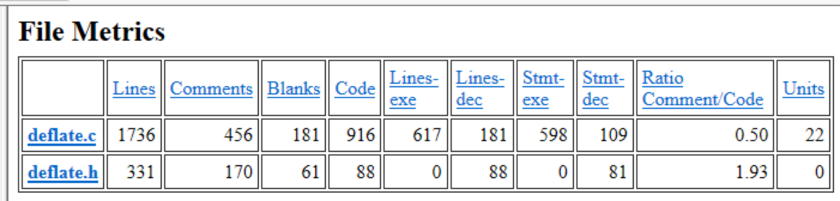
File Metrics Report
The File Metrics Report provides information similar to that in the Program Unit Metrics Report. However, it is organized by file rather than by program unit
File Average Metrics Report
The File Average Metrics Report provides averages for the functions within a file.
Importing Report Plugins
Using Metrics
About Metrics
Metrics Summary
Metrics Browser
Exporting Metrics to HTML
Exporting Metrics to a CSV File
Configuring Metric Charts
Using the Metrics Treemap
Exporting Dependency Metrics
Exporting Dependencies to a CSV File
Exporting Dependencies to a CSV Matrix File
Exporting Dependencies to Cytoscape
Using Graphical Views
Project Overview Graphics
Project > Project Overview Charts
Graphical View Browsers
There are two main types of graphical views in these menus: hierarchy views and structure views
Hierarchy Views
A hierarchy view shows multiple level relationship between entities. All relationships are multi-level and are shown to the top or bottom of their respective tree unless a level option is set in the preferences.
Cluster views are a special type of hierarchy view. They provide a more interactive view of call relationship. The Call, Callby, Butterfly and Internal Call variants are available, and can be accessed from the function, class, file, or architecture level.
Structure Views
Structure views offer a one glance way to see important structure and relationship information about a given entity.
General Commands for Using Graphical Browsers
Filtering Out Entities
Reuse Checkbox
Sync Checkbox
Graph Options
Types of Views
Hierarchy View Types
- Butterfly: Shows both calls and called by
- Calls: Shows who this entity calls
- Calls Relationship: Show the call relationships between two entites
- Called By: Shows who calls a given entity
- Calledby Relationship: Show the callby relationships between two entities
- Include: Shows who this file includes
- IncludeBy: Shows who includes this file
- Depends On Graph, Depended On By Graph, and Butterfly Graph: Available for classes, packages, and architectures only
- Derived Classes: Shows classes derived from a given class
- Base Classes: Show what classes are the base for a class
- Extended By: Shows which classes are extended by this class
- Class Inheritance: Shows who inherits from a given class
- Child Lib Units: Shows Child Library Units of a compilantion unit(Ada 95 only)
- Declared In: Show the declaration tree from where this program unit is declared
- Declaration Tree: Shows declaration nesting of program units in a compilation unit
- Instantiate From: Shows instantiation tree of generic type or compilation unit
- Instantiations: Shows who instantiates a given generic unit
- Invocation: Shows what compilation units a unit invoke
- Parent Lib Unit: Shows the parent lib units of a given entity
- Type Derived From: Shows tree of types a type is derived from
- Type tree: Shows types that derive new types from an entity
- With: Shows waht compilation unit an entity "Withs" into scope
- With By: Shows what compilation units "Withs" a given entity
- Uses: Shows which modules use this item
- Used By: Shows which modules are used by this item
- Cluster Call Internal: Shows call relationships within a file
- Cluster Call: Shows who this entity calls
- Cluster Callby: Shows who calls this entity
- Cluster Call Butterfly: Shows both calls and called by
Hiearchy View Examples
Buttefly: Shows both calls and called by relationships if they exist. The selected entity is outlined in red
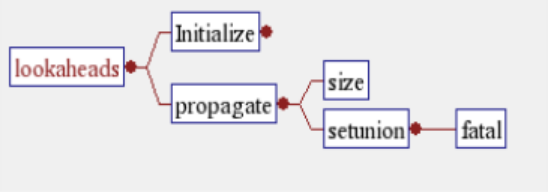
Calls: Shows the entire chain of emanating from this function. Each line between entities is read as "x calls y"
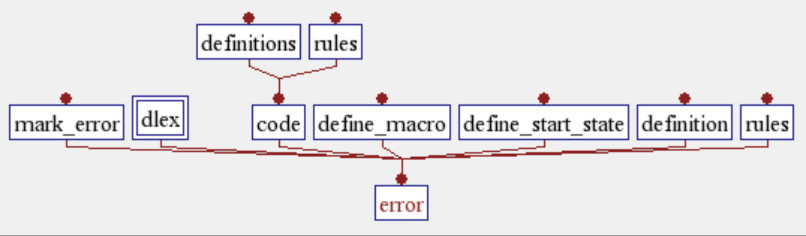
Called By: Shows what calls an entity. Each line connecting an entity is read as "x is called by y". In this example, error is called by code(and others), which is called by rules(and others). Note that this view is read from the bottom up or right to left
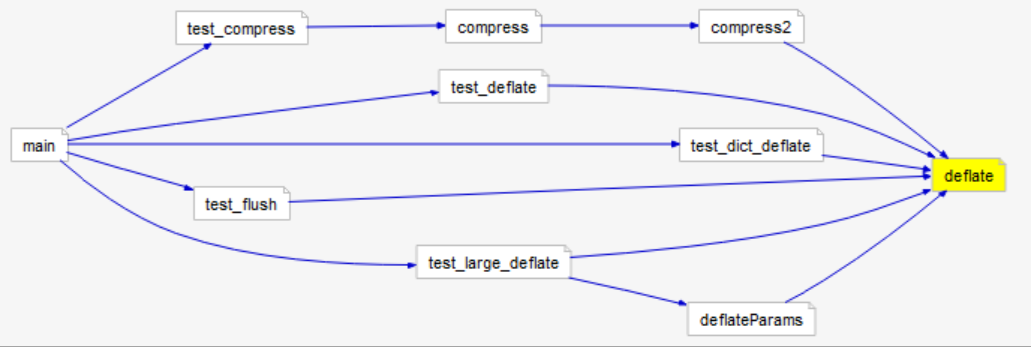
Calls Relationship/Calledby Relationship: Shows the call or callby relationship between any two entites. First, right-click on the first entity and select the graph you want to view. Then, click on another entity whose relationship to the first entity you want to find. You can click on the second entity anywhere in the Understand interface. The entity name will appear in the "Select a second entity" dialog. This example shows the callby relationship from the deflate() function to main()
Include: Shows the include hierarchy of an entity, such as a file. A connecting line is read as "x includes y".In this example, align.h includes global.h
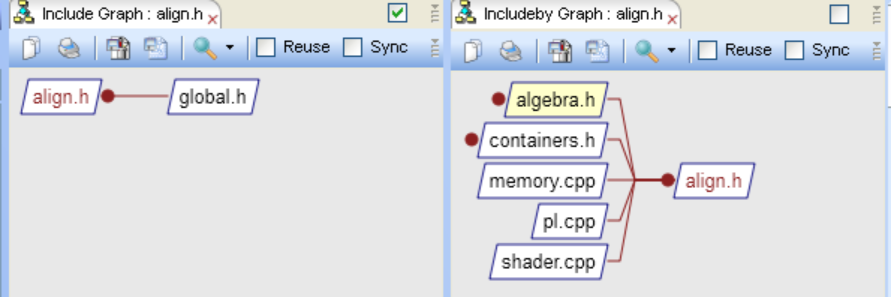
Included By: Show the include tree in the other direction. In the previous example, aligh.h is included by serveral files such as algebra.h
Base classes: For example, shows the base classes from which this class is derived from. In this example, class CLinearCurve is derived from class CCurve, which is derived from class CSurface and so on

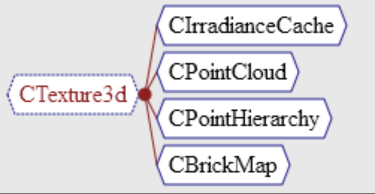
Derived Classes: Shows the classes that are derived from this class. In this example, class CTexture3d is a base class for classes CIrradianceCache and others.
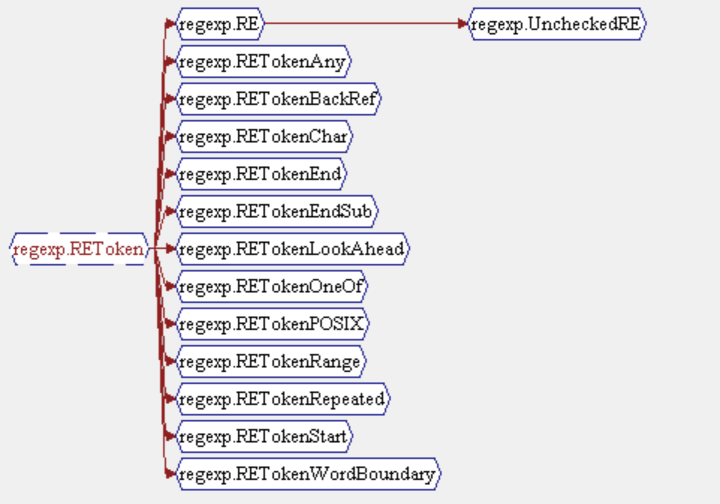
Extended By: Shows which classes are extended by other classes. A line is read as "class is extended by class". In this example, the regexp.REToken class is extended by a number of classes, including the regexp.RE class, which in turn is extended by the regexp.UncheckedRE class
Structure View Types
Structure views offer a one glance way to see important structure and relational information about a given entity. Understand structure views include the following:
- Graphic Architecture: Shows the hierarchy of an architecture node.
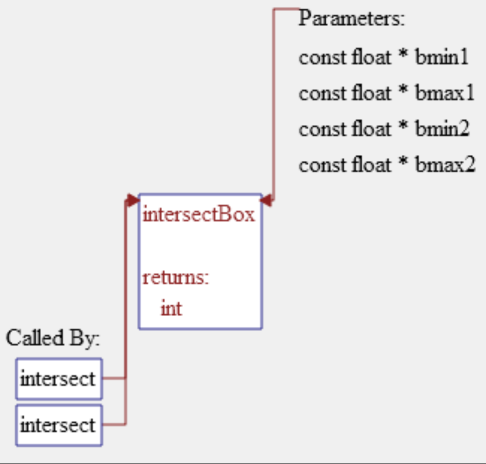
- Declaration: Shows what a structure is composed of. For example, shows the parameters, return type, and callbys of a function.For classes, shows what memebers are provided, who inherits this class, and who it is based on
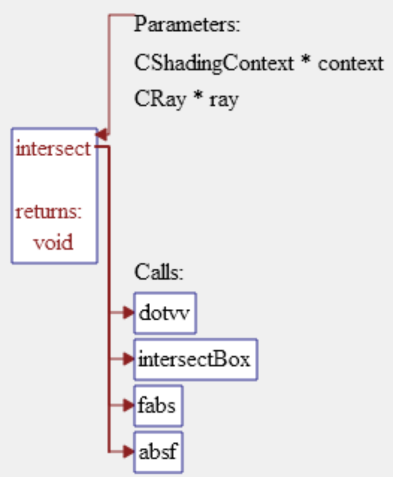
- Parent Declaration: Shows what a structure is composed of. Shows Calls instead of the Called Bys shown by a Declaration graph
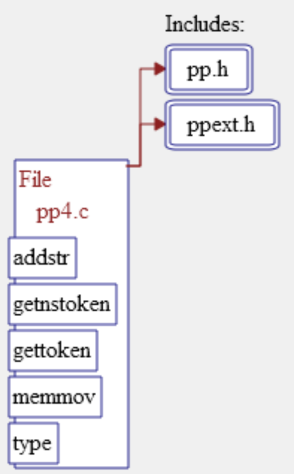
- Declaration File: Shows what entities (such as functions, types, macros, and variables) are defined within a given file
- Declaration Type: Shows what a type is composed of.
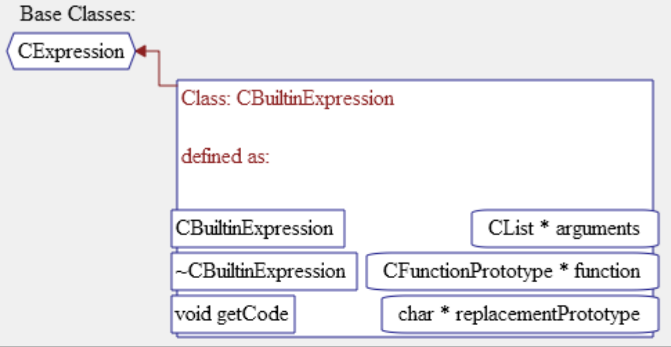
- Class Declaration: Shows the members defining the class and the parent class
- Data Members: Shows what components a class, struct, or type contains.
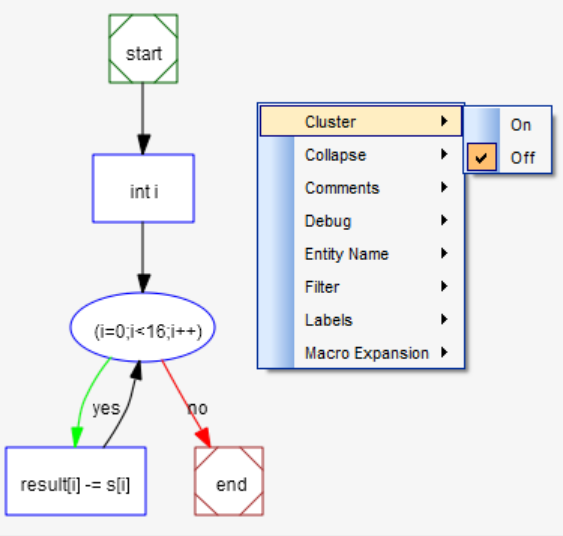
- Control Flow: Shows a flow chart of the function or similar entity type. Clicking on a node in the graphs jumps to the line of code referenced.
- Cluster Control Flow: Shows a flow chart of the function or similar entity type. This view type is more interactive than the Control Flow view.
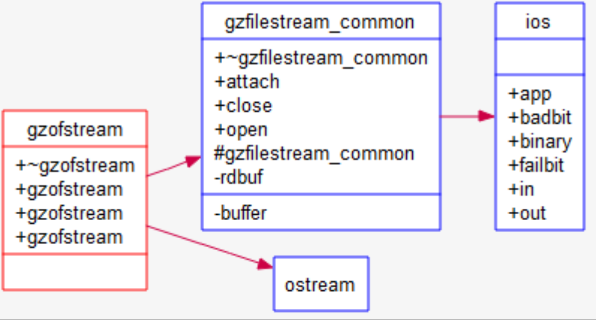
- UML Class Diagram: Shows the classes defined in the project or a file and related classes. Adheres to the Unified Modeling Language(UML) structures diagram format.
- UML Sequence Diagram: Shows interactions between entities arranged by time sequence.This graph is available for functions and methods that call member methods.
- Package: Shows what entities are declared in a given package(body or spec)
- Task: Shows the parameters, invocations, and what entities/entry points are declared in a task. Also shows what the task Withs
- Rename Declaration: Shows what entities are renamed in the entity
Structure View Examples
Understand structure views are designed to present essential information about an entity in a small and concise manner.
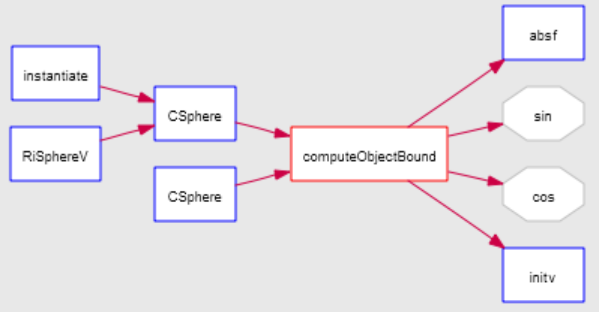
Declaration: Shows the structure of the entity. For example, shows the parameters, return type, and callby of a function
Parent Declaration: Similar to a Declaration graph but shows what the entity calls
UML Class Diagram: Shows the classes defined in the project or a file and related classes. Right-click to show or hide class details, related classes, and solo classes
Declaration File: Shows the entities declared in the file. Also shows files included by the file and classes imported by the file
Declaration Type: Shows information about a type declaration

Class Delcaration: Shows the members defining the class and the parent class from which it is derived
Control Flow: Shows a flow chart of the function or similar entity type. As the following figure shows, a number of specialized options can be set when you right-click on this type of graph
Graphical Notation
The following symbols are used by Understand to represent various language constructs. The symbols vary somewhat depending upon the type of view
- Entities such as functions and other program units are shown in rectangles
- Files and system-level entities are usually shown in parallelograms
- Classes and types are shown in flattened hexagons
- Macros are usually shown in flattened octagons
- Objects such as variables are usually shown in slightly rounded rectangles
- Unknown or unresolved entities are drawn with dashed outlines or in gray
- Other shapes are language-specific
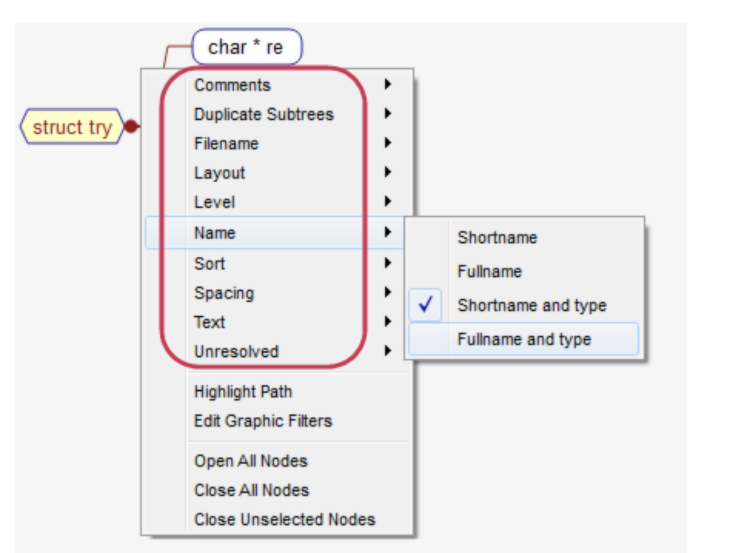
Controlling Graphical View Layout
This sections applies to non-cluster graphs.
Called by Menu
Comments Menu
Constants Menu
Default Members Menu
Dependent Of Menu
Dependent Menu
Depth
Duplicate Subtrees Menu
Expand Recursive Notes
Expand Repeated Notes
Extended By Menu
Extends Menu
External Functions Menu
Filename Menu
Function Pointer Menu
Globals Menu
Implements Menu
Implemented By Menu
Imports Menu
Included By Menu
Includes Menu
Inherits Menu
Inherited By Menu
Includes By Menu
Intrinsic Function Menu
Invocations Menu
Layout Menu
Level Menu
Locals Menu
Members Menu
Name Menu
Objects Menu
Operators Menu
Parameters Menu
Private Members Menu
Protected Members Menu
Public Members Menu
Renames Menu
Routines Menu
Scale Menu
Sport Menu
Spacing Menu
Sql Menu
Static Menu
Text Menu
Types Menu
Typetex Menu
Unknown Menu
Unresolved Menu
Usedby Menu
Uses Menu
Variables Menu
Withs Menu
With Bys Menu
Controlling Cluster Graph Layout
Cluster graphs are a special type of hierarchy view. They provide a more interactive view of call relationships than other hierarchy views. The Cluster Call, Cluster Callby, Cluster Call Butterfly, Cluster Call Internal, and Cluster Control Flow variants are available, and can be accessed from the function, class, file, or architecture level.
- Aggregatee Nodes by: Choose an architecture you want to organize entity nodes
- Edges Shown: Choose which relationships to the originally selected entity you want shown. "Forward" is call relationships. "Reverse" is callby relationships "Butterfly" is both call and callby relationships
- Entity Name Format as: Choose whether you want to display short or long names for entities.
- Highlight Paths to Selected Node(s): You can highlight all paths between the node for which you opened a Cluster Call or Cluster Callby graph and some other node. To do this, select a node (not the orginal node), right-click on the background of the graph (not on an entity or within a box), and choose this option. You can hold down the Ctrl key to select multiple entities for path highlighting
- Include Virtual Edges: Set this item to On if you want to show override and overriddenby edges.
- Show Edge Labels: Set this item to On if you want the number of occurrences of this relation to be shown in the Graph. For bi-directional call relationships, the two numbers in the label show calls in each direction
- Show Legend: Set this item to On if you want to show a graph legned in the upper left. The legend identifies the shapes and arrow styles used in the graph
- Show Node Children By Default: Set this item to On if you want nodes to be opened by default when you open a cluster graph. For example, all functions within files will be shown by default if this option is enalbed when you open the Cluster Callby graph for a file
Cluster Control Flow Graphs
Cluster Control Flow graphs show the execution flow of an entity such as a function.

- Allow Call Expansion: Allows called functions to be expanded by clicking. If this option is on, expandable calls are shown as a 3D box. Off by default
- Cluster: Uses a box to enclose statements in a group such as the "if" or "else" branch of a conditional statement. On by default
- Collapse: Combines statements into a single box if there are no decision between them. On by default
- Debug: Shows details about the information about each item in the flow. In order, the detail information is: nodeID, nodeKind, startLine, startCol, endLine, endCol, endNode, commaSeparatedListOfChildren. Off by default
- Expand Macros: Enabling this option shows macros expanded if you have enabled the Save macro expansion text option in the C++ project configuration(C++ (Fuzzy) Options). Off by default
- Filter: Hides implicit actions, such as "endif", On by default
- Layout: Choose whether to arrange the graph vertically or horizontally. The default is Vertical
- Show Comments: Shows comments associated with statement in the graph. On by default
- Show Finally-Block Flows: Shows edges representing exceptional exits from a try-catch block in languages like Java and C#. On by default
- Show Entity Name: Shows the name of the entity in the Start box at the beginning. Off by default. You can also choose to show entity names with parameters included
- Show Labels: Shows text for edges(for example, yes/no) and start block. On by default
- Show Legend: Set this item to On if you want to show a graph legend in the upper left. The legend identifies the shapes an arrow styles used in the graph
- Show Source Code: Shows source code in boxes. On by default
- Styled Labels: Highlights keywords, comments, and strings in source code shown in the graph.
Saving Graphical Views
Saving Views to Files
Saving Views as Visio Files
Saving Views as DOT Plugins
Importing Graphical View Plugins
Printing Graphical Views
Graphical View Printing
Using CodeCheck for Standards Verification
About CodeCheck
Running a CodeCheck
Files Tab
Checks Tab
Exporting and Importing Configurations
Viewing CodeCheck Results
Using the Result Log
Using the Results by File Tab
Using the Results by Check Tab
Using the Result Locator
Using the Result Treemap
Printing and Exporting Results
Ignoring Checks and Violations
Using CodeCheck Configurations
Writing CodeCheck Configurations
Installing Custom Scripts
Comparing Source Code
Comparing Files and Folders
Comparing Entities
Comparing Text
Exploring Difference
Code Comparison
Patch File
Difference List
Running Tools and External Commands
Configuring Tools
Variables
Adding Tools to the Context Menus
Adding Tools to the Tools Menu
Adding Tools to the Toolbar
Importing and Exporting Tool Commands
Running External Commands
Using the Eclipse Plugin
Command Line Processing
Using the und Command Line
Getting Help on Und
Creating a New Project
Adding Files to a Project
Removing Items from a Project
Getting Information about a Project
Modifying Project Settings
Importing into a Project
Exporting from a Project
Analyzing a Project
Generating Reports
Generating Metrics
Using CodeCheck
Running Perl Scripts
Creating a List of Files
Using the understand Command Line
Using Buildspy to Build Understand Projects
Quick Reference
File Menu
Edit Menu
Search Menu
View Menu
Project Menu
Reports Menu
Metrics Menu
Graphs Menu
CodeCheck Menu
Annotations Menu
Tools Menu
Window Menu
Help Menu