Prometheus is an open source monitoring platform that help you analyze and monitor infrastructure components. Prometheus server collects metrics from targets by scraping HTTP endpoints.
Minio now has built-in support for exporting Prometheus compatible data on an unauthenticated endpoint. This enables Prometheus monitoring for Minio server deployments without sharing server credentials and eliminates the need to run an external Prometheus exporter.
In this post, we’ll take a look at the data points available under a Minio Prometheus endpoint, and see how to use those fields to create critical alerts for Minio based storage infrastructure. Finally, we’ll also see how to visualize the data points using Grafana.
Setup Minio and Prometheus
Setting up Prometheus to scrape Minio endpoints is straightforward. Follow the [How to monitor Minio server with Prometheus] guide to setup Minio server monitoring with Prometheus.
Note that Prometheus support was added in Minio server release RELEASE.2018–05–11T00–29–24Z , so you need to have this version or later running. To get started with Minio, refer Minio QuickStart Document.
Minio Prometheus exporter fields
Minio uses the Prometheus Go client along with internal administration data to instrument and export data. Here are the data points that you can expect from the Minio Prometheus endpoint.
- Uptime (available for Minio server/gateway)
process_start_time_seconds : This stores the time since Minio server process started. You can use it with Prometheus query language to generate interesting insights easily. For example, get Minio server uptime using time() — process_start_time_seconds and detect crash loops using changes(process_uptime_seconds[30m])
- Storage (available for Minio server instances only)
minio_disk_storage_used_bytes : This is the total disk storage used by Minio server (in bytes).
If caching is enabled, following additional metrics are available
minio_disk_cache_storage_bytes : This is the total cache capacity available for current Minio instance (in bytes).
minio_disk_cache_storage_free_bytes : This is the free cache capacity available to current Minio instances (in bytes).
- Request duration (available for Minio server/gateway)
Request duration information is split into request types using Prometheus Histogram metric type. The basename for this metric is minio_http_requests_duration_seconds . You can add _bucket to the basename to get cumulative counters for all the request types. So, minio_http_requests_duration_seconds_bucket will show something like this:
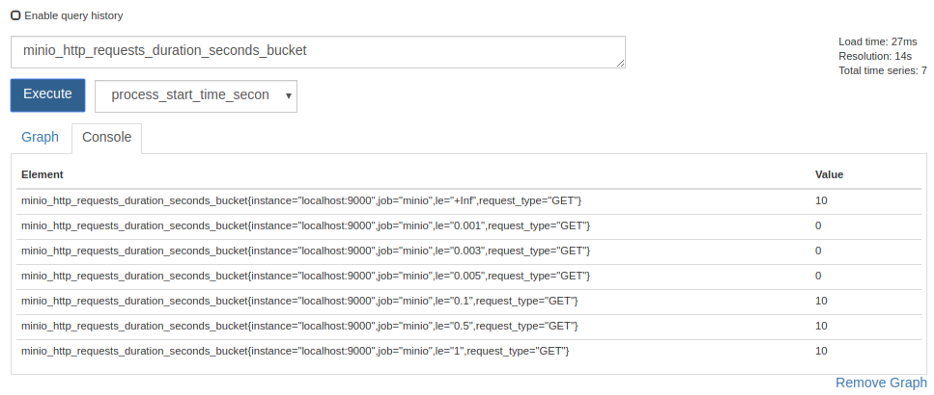
Other options are minio_http_requests_duration_seconds_sum which shows the current aggregate time spent servicing all HTTP requests in seconds, and minio_http_requests_duration_seconds_count which shows the sum of all requests served.
- Network statistics (available for Minio server/gateway)
minio_network_received_bytes_total : This shows the total number of bytes received by Minio server (in bytes).
minio_network_sent_bytes_total : This is the total number of bytes sent by Minio server (in bytes).
- Disk statistics (available for Minio server instances only)
minio_total_disks : This is the total number of disks available to Minio server.
minio_offline_disks : This is the count of total offline disks.
Use Cases
Monitoring alone is of not much use until you have a integrated alerting system that notifies concerned stakeholders whenever something goes wrong. Thankfully Prometheus does all this and more.
Once Minio server data is plugged into Prometheus monitoring, you can configure Prometheus alertmanager and create alerting rules. This way you have production ready, end to end monitoring and alerting setup.
Let’s explore some interesting use cases of such alerting setup.
- Alert when disk is offline
Using the minio_offline_disks field, you can set up alerts if disk(s) are offline on a Minio server instance. This is how a sample alerting rule would look
groups:
- name: Minio
  rules:
  - alert: DiskOffline
    expr: minio_offline_disks != 0
    for: 5m
    labels:
      severity: page
    annotations:
summary: Disk offline- Alert when free space is less than specified threshold
Using the minio_disk_storage_free_bytes field, you can set up alerts when a Minio server instance is running low on available storage space. A sample alerting rule would look like this
groups:10737418240
- name: Minio
rules:
- alert: StorageSpaceExhausted
expr: minio_disk_storage_free_bytes <
labels:
severity: page
annotations:
summary: Free space threshold reached
This will fire an alert when free bytes reaches below 10GiB.
- Alert when a Minio server instance is under high load
Following above examples, you can set up alerts when Minio server is under high load, using the minio_http_requests_duration_seconds_bucket field.
Grafana
Grafana is a visualization platform to understand metrics. It integrates very well with Prometheus and helps visually analyze Prometheus data. If you followed along till now, you already have Minio data coming into your Prometheus server.
Let us now see how to set up Grafana to fetch data from Prometheus and visualize it via Grafana dashboard.
- Install Grafana
On Ubuntu/Debian based platforms, Grafana already has deb packages available. Install it using
$ wget https://s3-us-west-2.amazonaws.com/grafana- releases/release/grafana_5.1.2_amd64.deb$ sudo apt-get install -y adduser libfontconfig$ sudo dpkg -i grafana_5.1.2_amd64.debOnce installed, start Grafana using
$ sudo service grafana-server startFor other platforms refer Grafana documentation. By default Grafana listens on port 3000. Access Grafana UI via browser on http://localhost:3000 . Default credentials are user name = admin and password = admin
- Create Dashboard
Once you have access to the UI, create a datasource for Grafana to fetch data from Prometheus. Click on Settings >> Data Sources >> Add Data Source. Then select Prometheus as the data type in the dropdown and add Prometheus URL and a name for the data source.
Then click Create >> Dashboard on the left side bar. Inside the dashboard, you can add panels. Select a graph as the new panel. Once the graph opens, click on the edit button on graph top menu bar. You can now edit graphs properties. Here you can choose any of the data points that Minio exposes and the data source.

While you’re at it, help us understand your use case and how we can help you better! Fill out our “Best of Minio” deployment form (takes less than a minute), and get a chance to be featured on the Minio website and showcase your Minio private cloud design to Minio community.