mysqld_exporter集中部署
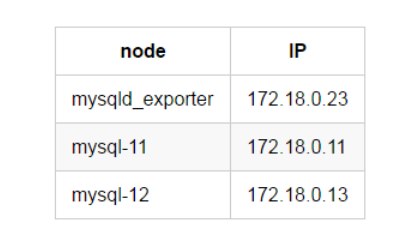
集中部署,就是说我们将所有的mysqld_exporter部署在同一台服务器上,在这台服务器上对mysqld_exporter进行统一的管理,下面介绍一下集中部署的方法。这里我们专门起一台IP为172.18.0.23的服务器,另外两台172.18.0.11和172.18.0.13作为2个MySQL节点。
在172.18.0.23上下载安装mysqld_exporter
略
添加172.18.0.11节点
1、在172.18.0.11上建立监控用户
GRANT SELECT, PROCESS, SUPER, REPLICATION CLIENT, RELOAD ON *.* TO 'pmm'@'%' IDENTIFIED BY 'pmm';
2、在172.18.0.23上编辑172.18.0.11节点的配置文件
[root@mysqld_exporter-23 /]# cd /data/mysqld_exporter/
[root@mysqld_exporter-23 mysqld_exporter]# cat etc/.dk-11.cnf
[client]
user=pmm
password=pmm
host=172.18.0.11
port=3306
3、在172.18.0.23上启动mysqld_exporter
[root@mysqld_exporter-23 ~]# cd /data/mysqld_exporter/
[root@mysqld_exporter-23 mysqld_exporter]# nohup ./mysqld_exporter --web.listen-address=172.18.0.23:9104 --config.my-cnf=etc/.dk-11.cnf --collect.auto_increment.columns --collect.binlog_size --collect.global_status --collect.global_variables --collect.info_schema.innodb_metrics --collect.info_schema.innodb_cmp --collect.info_schema.innodb_cmpmem --collect.info_schema.processlist --collect.info_schema.query_response_time --collect.info_schema.tables --collect.info_schema.tablestats --collect.info_schema.userstats --collect.perf_schema.eventswaits --collect.perf_schema.file_events --collect.perf_schema.indexiowaits --collect.perf_schema.tableiowaits --collect.perf_schema.tablelocks --collect.slave_status &
这里看到mysqld_exporter的启动多了两个选项,"--web.listen-address"和"--config.my-cnf"。
web.listen-address代表这个mysqld_exporter进程绑定的端口,以供prometheus调用,这里暴露的是172.18.0.23的9104端口。
config.my-cnf代表这个mysqld_exporter进程监控的MySQL的连接信息。
4、在prometheus服务器配置prometheus文件
[root@prometheus-21 /]# cd /data/prometheus/
[root@prometheus-21 prometheus]# cat prometheus.yml
# my global config
global:
  scrape_interval: 15s # Set the scrape interval to every 15 seconds. Default is every 1 minute.
  evaluation_interval: 15s # Evaluate rules every 15 seconds. The default is every 1 minute.

# A scrape configuration containing exactly one endpoint to scrape:
scrape_configs:
  - file_sd_configs:
    - files:
      - mysql.yml
    job_name: MySQL
    metrics_path: /metrics
    relabel_configs:
    - source_labels: [__address__]
      regex: (.*)
      target_label: __address__
      replacement: $1
5、在prometheus服务器配置mysql.yml文件
[root@prometheus-21 prometheus]# cat mysql.yml
- labels:
    instance: dk-11:3306 # grafana显示的实例的别名
  targets:
  - 172.18.0.23:9104 # mysqld_exporter暴露的端口
mysql.yml的172.18.0.23:9104会通过prometheus配置文件中的file_sd_configs配置,作为变量传给$1,然后替换__address__,因而被prometheus所识别。
6、使prometheus配置生效
[root@prometheus-21 prometheus]# pgrep -fl prometheus
33 /data/prometheus/prometheus --storage.tsdb.retention=30d
[root@prometheus-21 prometheus]# kill -HUP 33
prometheus.yml文件更改后需要上述操作后生效,mysql.yml修改后prometheus会自动识别。
7、验证172.18.0.11是否添加成功
浏览器输入Prometheus_IP:9090
浏览器输入Grafana_IP:3000
添加172.18.0.13节点
添加新的节点到监控,只需要做4步就可以。
1、在172.18.0.13上建立监控用户
GRANT SELECT, PROCESS, SUPER, REPLICATION CLIENT, RELOAD ON *.* TO 'pmm'@'%' IDENTIFIED BY 'pmm';
2、在172.18.0.23上编辑172.18.0.13节点的配置文件
[root@mysqld_exporter-23 /]# cd /data/mysqld_exporter/
[root@mysqld_exporter-23 mysqld_exporter]# cat etc/.dk-13.cnf
[client]
user=pmm
password=pmm
host=172.18.0.13
port=3306
3、在172.18.0.23上启动mysqld_exporter
[root@mysqld_exporter-23 ~]# cd /data/mysqld_exporter/
[root@mysqld_exporter-23 mysqld_exporter]# nohup ./mysqld_exporter --web.listen-address=172.18.0.23:9105 --config.my-cnf=etc/.dk-13.cnf --collect.auto_increment.columns --collect.binlog_size --collect.global_status --collect.global_variables --collect.info_schema.innodb_metrics --collect.info_schema.innodb_cmp --collect.info_schema.innodb_cmpmem --collect.info_schema.processlist --collect.info_schema.query_response_time --collect.info_schema.tables --collect.info_schema.tablestats --collect.info_schema.userstats --collect.perf_schema.eventswaits --collect.perf_schema.file_events --collect.perf_schema.indexiowaits --collect.perf_schema.tableiowaits --collect.perf_schema.tablelocks --collect.slave_status &
# 这里暴露的是9105端口,使用的是.dk-13.cnf的文件。
4.在prometheus服务器配置mysql.yml文件
[root@prometheus-21 prometheus]# cat mysql.yml
- labels:
    instance: dk-11:3306
  targets:
  - 172.18.0.23:9104
- labels:
    instance: dk-13:3306
  targets:
  - 172.18.0.23:9105
只需要添加172.18.0.13的mysqld_exporter对应的端口和别名就可以。
5、验证172.18.0.13是否添加成功
浏览器输入Prometheus_IP:9090
浏览器输入Grafana_IP:3000
集中管理
当我们需要添加新的节点,只需要将新节点的连接信息配置好,划分新的端口,启动mysqld_exporter,然后在prometheus中的mysql.yml文件添加新节点暴露的端口以及新节点的自定义别名就可以了。
这样我们就可以在mysqld_exporter节点上对mysqld_exporter的进程进行统一管理了。
改造
文章地址:https://www.cnblogs.com/sanduzxcvbnm/p/13094580.html
根据这篇文章的讲述,可以稍加改造,使用多个mysqld_exporter.service服务,名称区分开,比如mysqld_exporter1.service,mysqld_exporter2.service等,在每个里面配置上数据库的连接信息