在Prometheus的架构中被划分成两个独立的部分。Prometheus负责产生告警,而Alertmanager负责告警产生后的后续处理。因此Alertmanager部署完成后,需要在Prometheus中设置Alertmanager相关的信息。
编辑Prometheus配置文件prometheus.yml,并添加以下内容
alerting:
  alertmanagers:
    - static_configs:
      - targets: ['localhost:9093']
重启Prometheus服务,成功后,可以从http://192.168.75.21:9090/config上查看alerting配置是否生效。
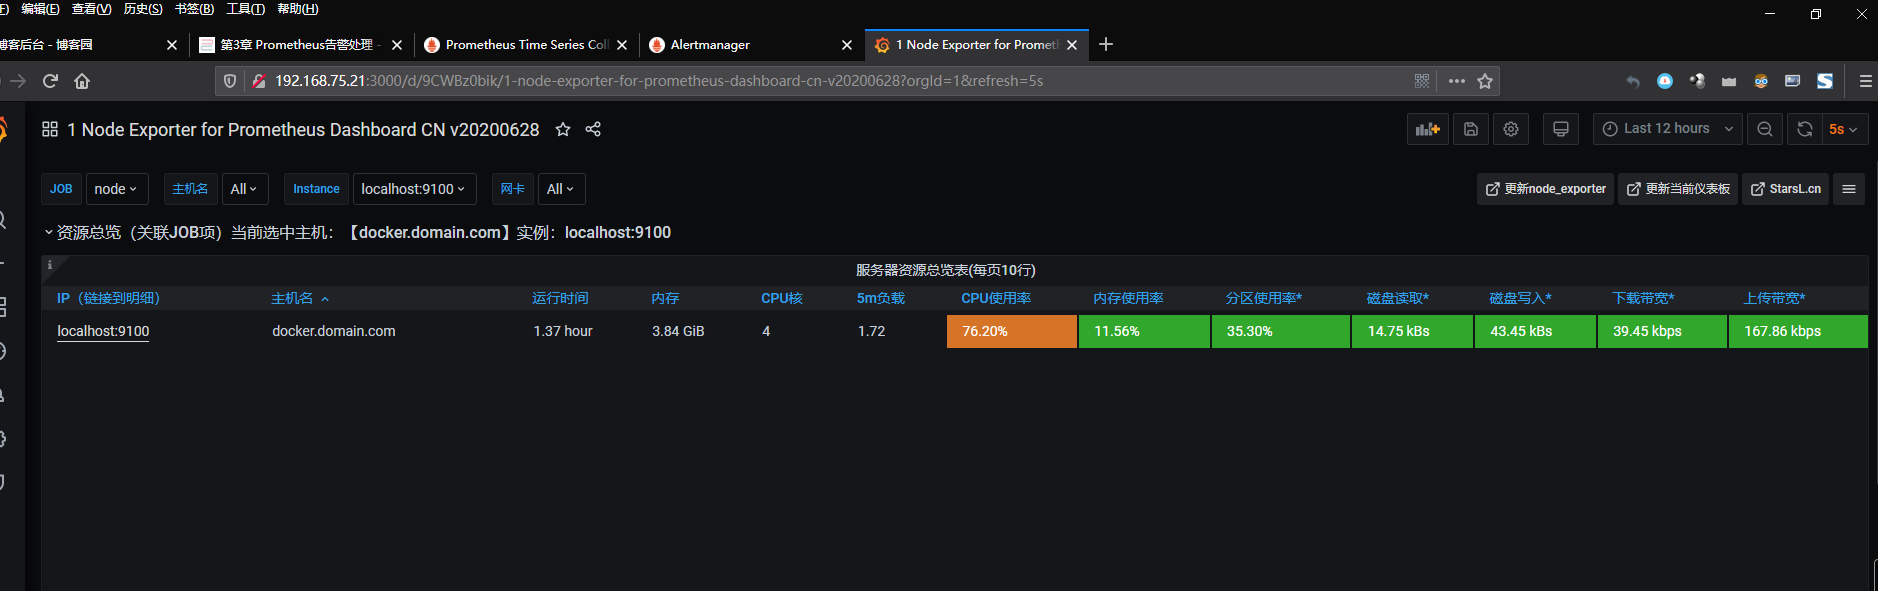
此时,再次尝试手动拉高系统CPU使用率:
cat /dev/zero>/dev/null
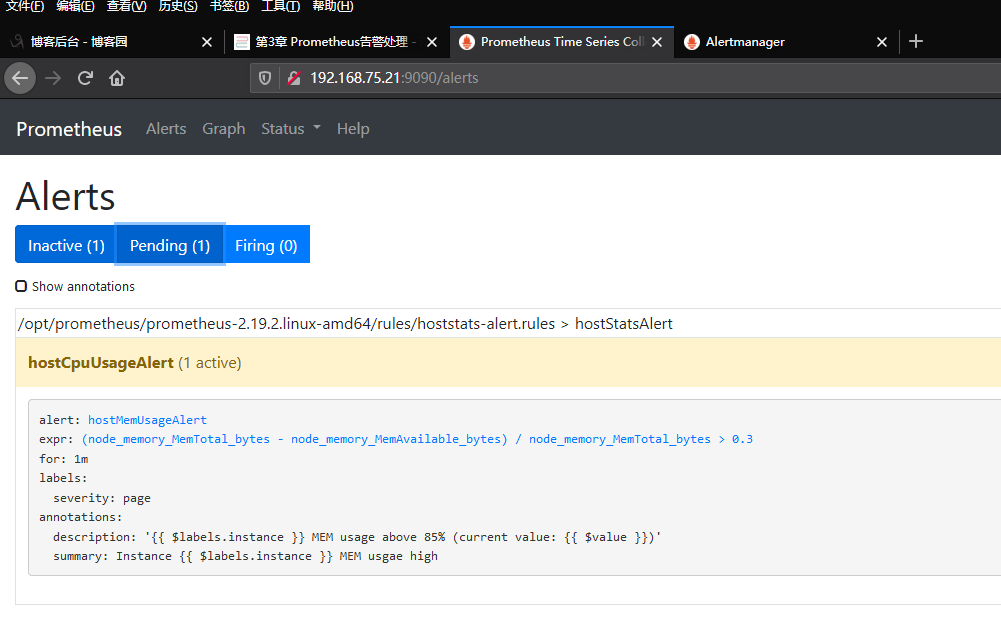
等待Prometheus告警进行触发状态:
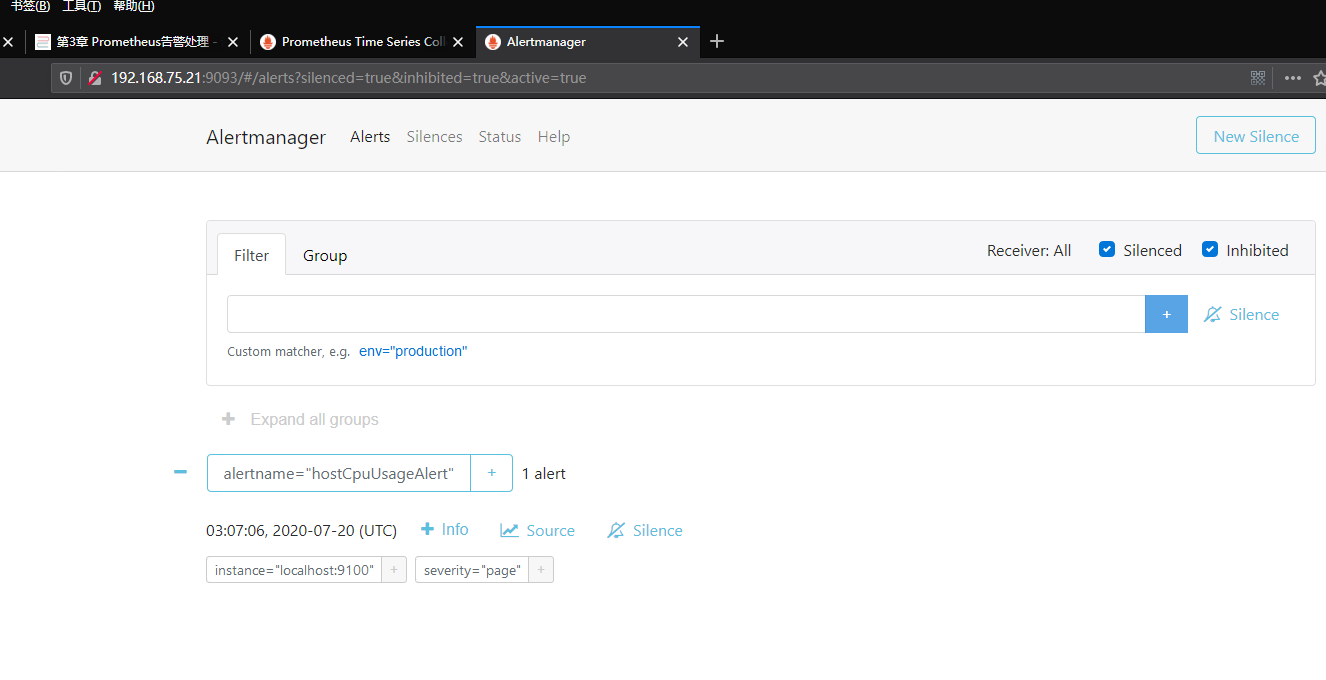
查看Alertmanager UI,此时可以看到Alertmanager接收到的告警信息。
查看grafana界面