修改自己不确定的配置文件前,先准备备份,防患于未然!!!
Environment:{
目前测试准备三台2m2g虚拟机 详情概略图见EFK的架构图
https://www.cnblogs.com/security-guard/
1、装filebeat 用于客户端web界面 172
2、安装logstash 139
3、安装elasticsearch kibana 128
}
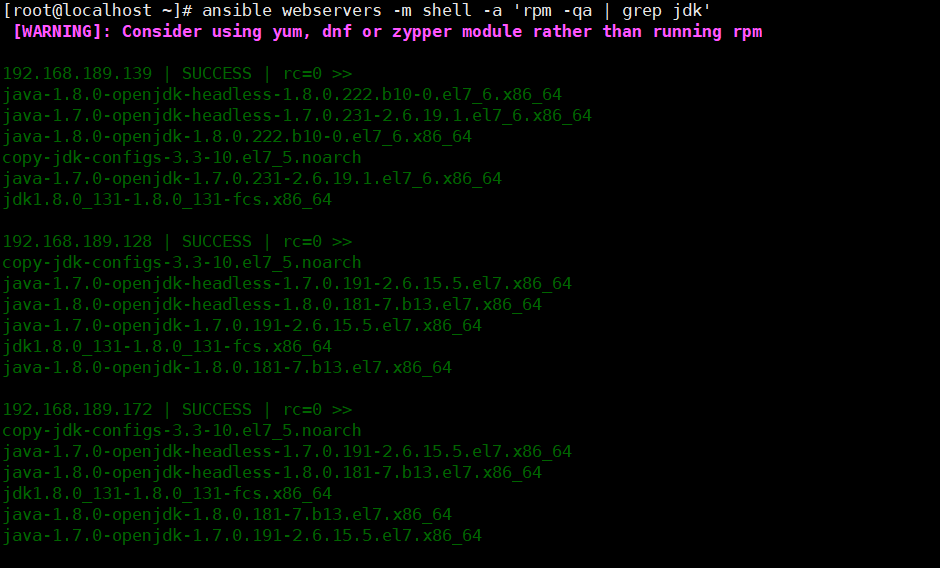
检测环境,确保均安装jdk环境

返回jdk环境数据
查看环境

移动压缩包到指定目录
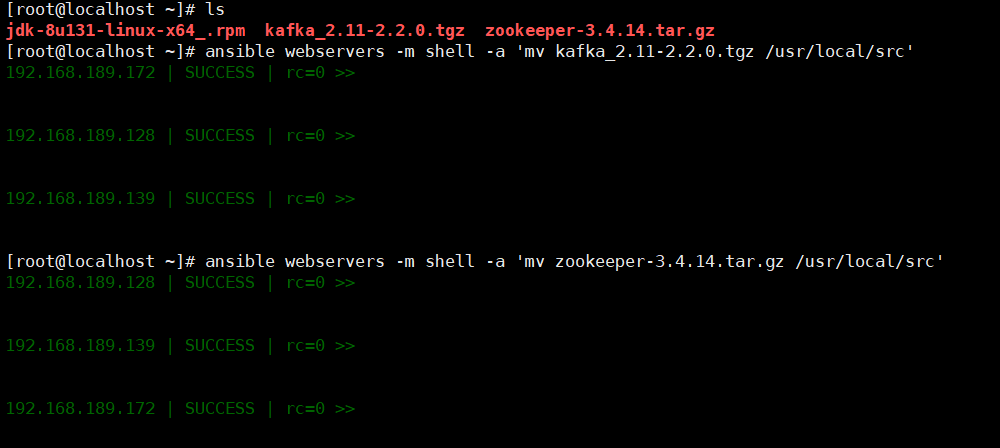
解压准备好的zookeeper kafka

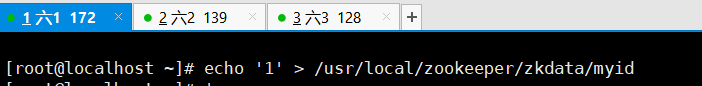
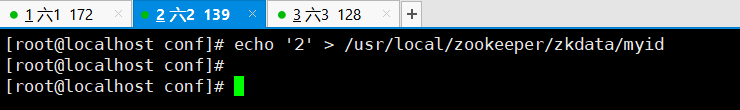
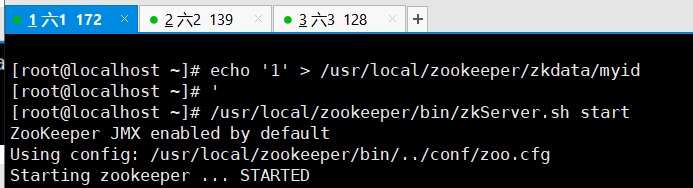
输入本机id,此步骤由于机器少,一次修改即可

开启 zookeeper服务并查看,现在本机器测试
可见是跟班角色
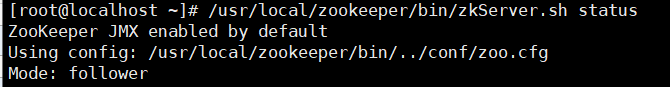
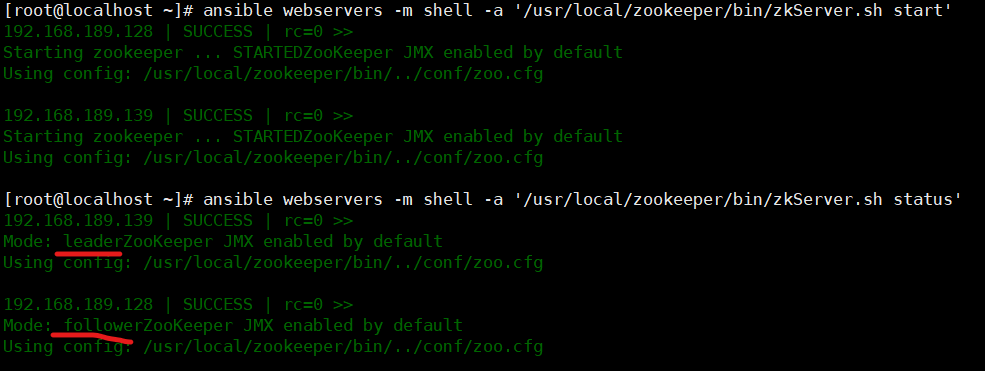
机器查看到状态,第一步完成
二、搭建kafka
vim /usr/local/kafka/config/server.properties
id号为前面echo的ID


各机器添加主机
需要配置的文件如下


启动kafka,首先进行测试,发现绝对路径不能实现kafka的启动

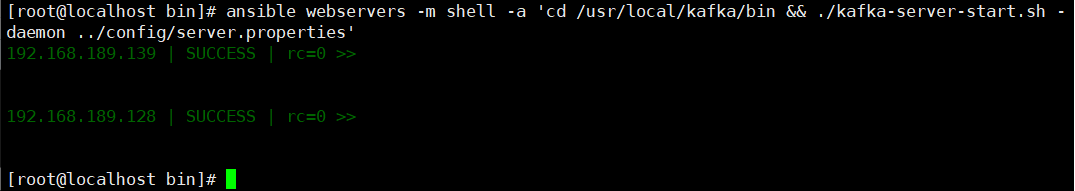
稍等片刻,查看端口,发现端口监听,kafka启动成功

三、以下操作为单机操作
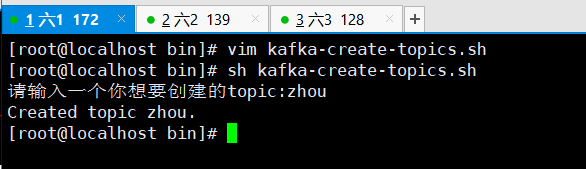
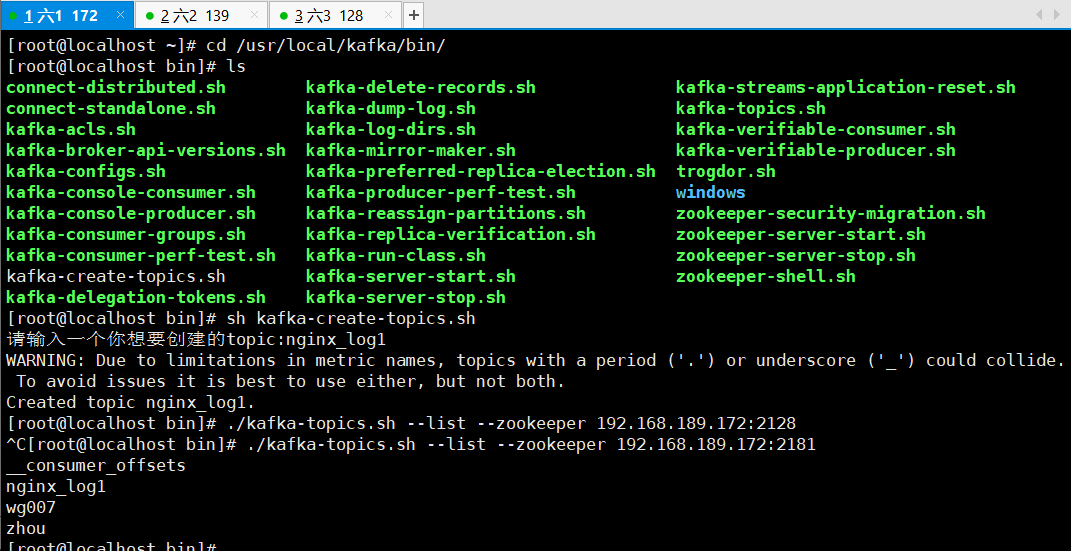
1、创建主题topic
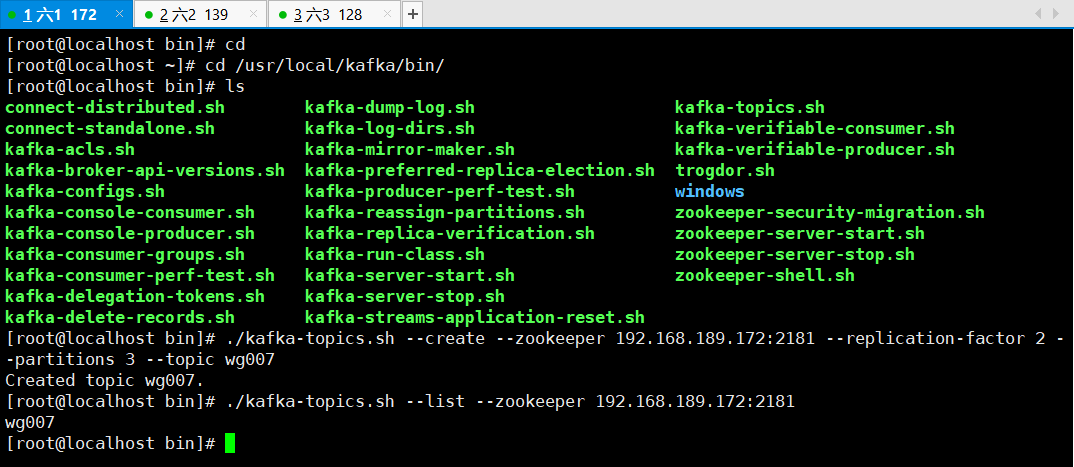
cd /usr/local/kafka/bin/
创建wg007的主题
./kafka-topics.sh --create --zookeeper 192.168.189.172:2181 --replication-factor 2 --partitions 3 --topic wg007
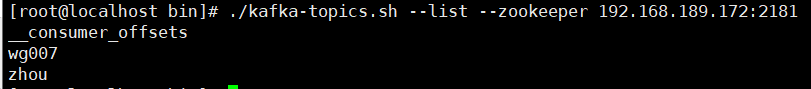
查看本机器有哪些主题
./kafka-topics.sh --list --zookeeper 192.168.189.172:2181
效果图
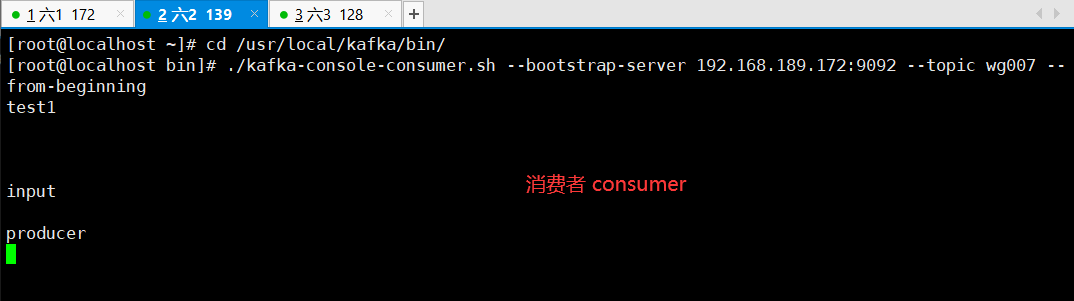
模拟生产者,会有小输入框 " > "

效果如下:

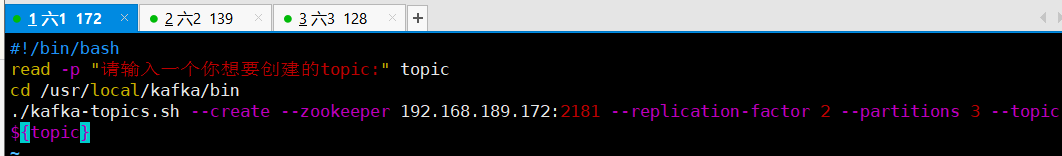
由于命令过长,添加脚本用以方便
四、创建yum源,用以下载filebeat
vim /etc/yum.repo.d/filebeat.repo
***加入以下内容
[filebeat-6.x]
name=Elasticsearch repository for 6.x packages
baseurl=https://artifacts.elastic.co/packages/6.x/yum
gpgcheck=1
gpgkey=https://artifacts.elastic.co/GPG-KEY-elasticsearch
enabled=1
autorefresh=1
type=rpm-md
添加以上内容即可yum直接下载filebeat

下一步配置filebeat的配置文件


批注:
cd /etc/filebeat
vim filebeat.yml
修改以下内容
enabled: true
paths:
- /var/log/nginx/*.log //写这个路径的前提是安装nginx
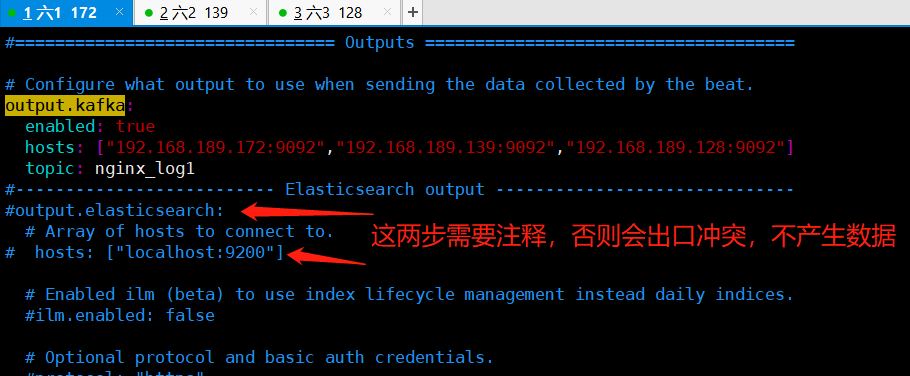
output.kafka:
enabled: true
# Array of hosts to connect to.
hosts: ["192.168.18.140:9092","192.168.18.141:9092","192.168.18.142:9092"]
topic: nginx_log1 //写这个nginx_log1 的前提是有nginx_log1的topic 上面有生产者的脚本
安装nginx
yum -y install epel*
yum -y install nginx
启动filebeat,nginx
systemctl start filebeat
systemctl enable filebeat
systemctl start nginx
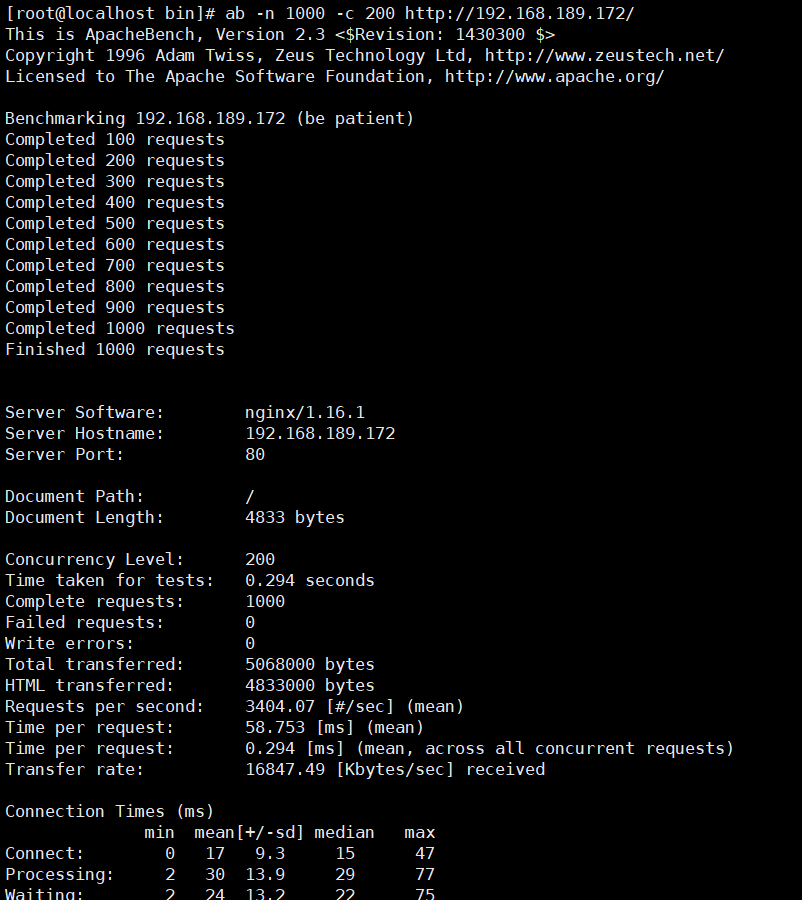
给nginx生产数据,此步骤采用ab压力测试,首先下载压测工具" httpd-tools "
yum -y install httpd-tools
 ab -n1000 -c 200 http://127.0.0.1/cccc   //这条命令可以多执行几次
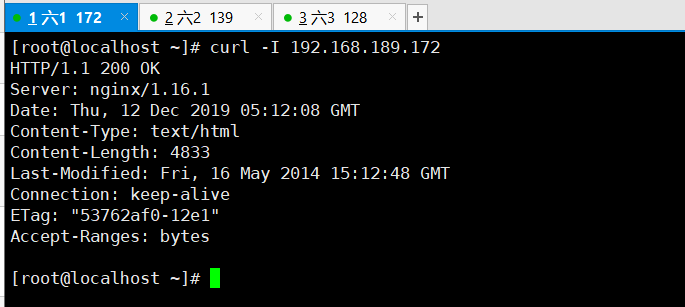
可以在安装filebeat的服务器上测试一下nginx的服务
curl -I 192.168.18.140:80
创建nginx_log1 的主题 topic
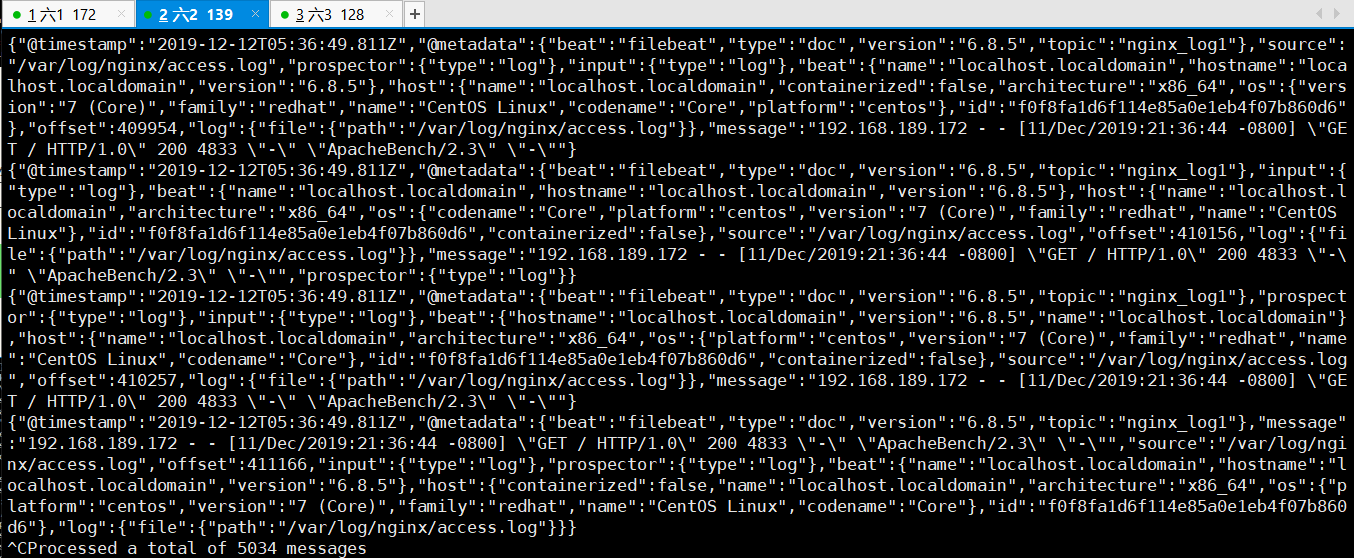
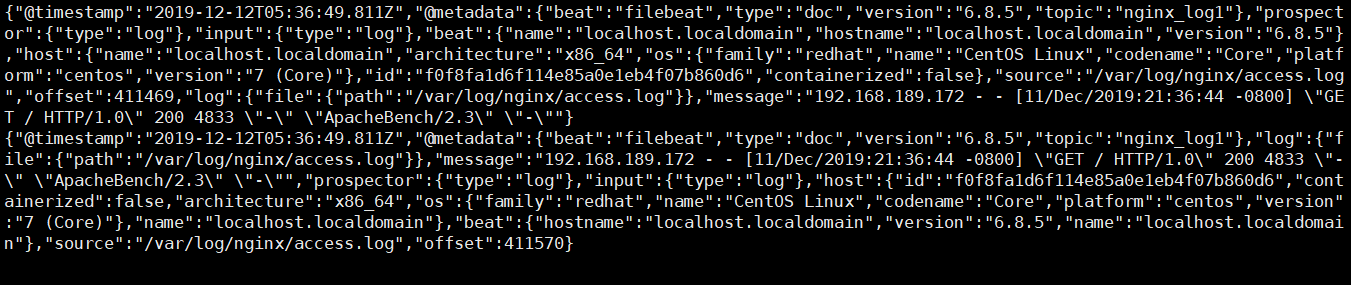
在模拟消费者的服务器上 如果可以显示一下内容 表示成功了
./kafka-console-consumer.sh --bootstrap-server 192.168.18.141:9092 --topic nginx2(这里的topic的名字一定要和filebeat的配置文件里的一致) --from-beginning
这一步的效果显示如下,通俗易懂的说法就是,模拟生产者做nginx压力测试,模拟消费者的服务器会看到nginx的日志
进行即时检测本操作的同步一致性
./kafka-console-consumer.sh --bootstrap-server 192.168.189.139:9092 --topic nginx_log1 --from-beginning
五、 现在开始收集多个日志 system nginx secure 和日志 编辑filebeat的配置文件
修改自己不确定的配置文件前,先准备备份,防患于未然!!!
filebeat.inputs:
- type: log
  enabled: true
  paths:
    - /var/log/nginx/*.log
  fields:
        log_topics: nginx_log1

- type: log
  enabled: true
  paths:
    - /var/log/messages
  fields:
        log_topics: messages

- type: log
  enabled: true
  paths:
    - /var/log/secure
  fields:
        log_topics: secure  //这个是收集secure的topic


output.kafka:
  enabled: true
  hosts: ["192.168.189.172:9092","192.168.189.139:9092","192.168.189.128:9092"]
  topic: nginx_log1

#processors:
#  - add_host_metadata: ~
#  - add_cloud_metadata: ~
注意:创建三个topic 就是上面的配置文件提到的topic 可以使用上面的脚本创建topic 重启filebeat
systemctl restart filebeat

六、接下来在第二台机器安装logstash 在第三台机器安装ES集群(elasticsearch和kibana)
安装logstash在第二台
rpm -ivh logstash-6.6.0.rpm
安装 kibana 和elasticsearch
rpm -ivh elasticsearch-6.6.2.rpm
rpm -ivh kibana-6.6.2-x86_64.rpm
配置elasticsearch文件
vim /etc/elasticsearch/elasticsearch.yml
############################
network.host: 192.168.18.142
http.port: 9200
启动elasticsearch
systemctl restart elasticsearch
配置kibana的配置文件
vim /etc/kibana/kibana.yml
######################
server.port: 5601
server.host: "0.0.0.0"
elasticsearch.hosts: ["http://192.168.18.142:9200"]

然后启动kibana
systemctl restart kibana

七、现在开始 编写logstash的三个配置文件 cd /etc/logstash/conf.d
cd /etc/logstash/conf.d
在此路径下创建我们之前创建的主题topic的相对配置文件
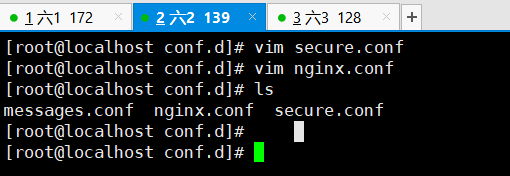
nginx配置文件
 1 vim nginx.conf
 2
 3 input {
 4         kafka {
 5         bootstrap_servers => ["192.168.189.172:9092,192.168.189.139:9092,192.168.189.128:9092"]
 6         group_id => "logstash"
 7         topics => "nginx_log1"
 8          consumer_threads => 5
 9         }
10 }
11 filter {
12     grok {
13         match => { "message" => "%{NGINXACCESS}" }
14     }
15 }
16 output {
17         elasticsearch {
18                 hosts => "192.168.189.128:9200"
19                 index => "nginx_log-%{+YYYY.MM.dd}"
20         }
21 }
secure配置文件
vim secure.conf

input {
        kafka {
        bootstrap_servers => ["192.168.189.172:9092,192.168.189.139:9092,192.168.189.128:9092"]
        group_id => "logstash"
        topics => "secure"
         consumer_threads => 5
        }
}
output {
        elasticsearch {
                hosts => "192.168.189.128:9200"
                index => "secure_log-%{+YYYY.MM.dd}"
        }
}
messages配置文件
vim messages.conf

input {
        kafka {
        bootstrap_servers => ["192.168.189.172:9092,192.168.189.139:9092,192.168.189.128:9092"]
        group_id => "logstash"
        topics => "messages"
         consumer_threads => 5
        }
}
output {
        elasticsearch {
                hosts => "192.168.189.128:9200"
                index => "_log-%{+YYYY.MM.dd}"
        }
}
添加管道
vim /etc/logstash/pipelines.yml
- pipeline.id: messages
  path.config: "/etc/logstash/conf.d/messages.conf"
- pipeline.id: nginx
  path.config: "/etc/logstash/conf.d/nginx.conf"
- pipeline.id: secure
  path.config: "/etc/logstash/conf.d/secure.conf"
正则匹配
cd /usr/share/logstash/vendor/bundle/jruby/2.3.0/gems/logstash-patterns-core-4.1.2/patterns
vim nginx_access

URIPARAM1 [A-Za-z0-9$.+!*'|(){},~@#%&/=:;_?-[]]*
NGINXACCESS %{IPORHOST:client_ip} (%{USER:ident}|- ) (%{USER:auth}|-) [%{HTTPDATE:timestamp}] "(?:%{WORD:verb} (%{NOTSPACE:request}|-)(?: HTTP/%{NUMBER:http_version})?|-)" %{NUMBER:status} (?:%{NUMBER:bytes}|-) "(?:%{URI:referrer}|-)" "%{GREEDYDATA:agent}"
重启logstash systemctl restart logstash
可以在第二台机器上查看模拟消费者的状态 messages的
执行下面的命令可以显示出日志内容就是成功
cd /usr/local/kafka/bin/./kafka-console-consumer.sh --bootstrap-server 192.168.18.141:9092 --topic nginx_log1 --from-beginning