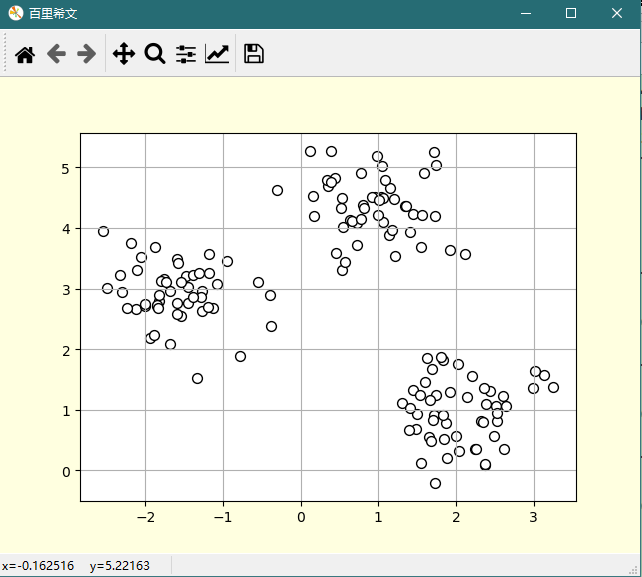
sklearn.datasets.make_blobs() 是用于创建多类单标签数据集的函数,它为每个类分配一个或多个正态分布的点集。
sklearn.datasets.make_blobs(
          n_samples=100,         # 待生成的样本的总数
          n_features=2,           # 每个样本的特征数
          centers=3,            # 要生成的样本中心(类别)数,或者是确定的中心点
           cluster_std=1.0,        # 每个类别的标准差
           center_box=(-10.0, 10.0),  #中心确定之后的数据边界,亦即每个簇的上下限
           shuffle=True,         # 是否将样本打乱
          random_state=None)      #随机生成器的种子
参数的英文含义:

n_samples: int, optional (default=100)
The total number of points equally divided among clusters.

n_features: int, optional (default=2)
The number of features for each sample.

centers: int or array of shape [n_centers, n_features], optional (default=3)
The number of centers to generate, or the fixed center locations.

cluster_std: float or sequence of floats, optional (default=1.0)
The standard deviation of the clusters.
如果生成2类数据,其中一类比另一类具有更大的方差,可以将cluster_std设置为[1.0,3.0]。


center_box: pair of floats (min, max), optional (default=(-10.0, 10.0))
The bounding box for each cluster center when centers are generated at random.


shuffle: boolean, optional (default=True)
Shuffle the samples.


random_state: int, RandomState instance or None, optional (default=None)
If int, random_state is the seed used by the random number generator; If RandomState instance, random_state is the random number generator; If None, the random number generator is the RandomState instance used by np.random.
返回值
X : array of shape [n_samples, n_features]
The generated samples.
生成的样本数据集。
y : array of shape [n_samples]
The integer labels for cluster membership of each sample.
样本数据集的标签。
示例:
# 导入相关模块
from  sklearn.datasets import make_blobs
import matplotlib.pyplot as plt

# 创建仿真聚类数据集
X, y = make_blobs(n_samples=150,
                  n_features=2,
                  centers=3,
                  cluster_std=0.5,
                  shuffle=True,
                  random_state=0)

# 绘制散点图
plt.figure('百里希文', facecolor='lightyellow')
plt.scatter(X[:, 0], X[:, 1], c='w', edgecolor='k', marker='o', s=50)
plt.grid()
plt.show()

