一、词频统计:
1.读文本文件生成RDD lines
lines = sc.textFile('file:///home/hadoop/word.txt')

2.将一行一行的文本分割成单词 words flatmap()
words = lines.flatMap(lambda line:line.split())
words.collect()

3.全部转换为小写 lower()
words = lines.flatMap(lambda line:line.lower().split())
words.collect()

4.去掉长度小于3的单词 filter()
words = words.filter(lambda word:len(word)>3)
words.collect()

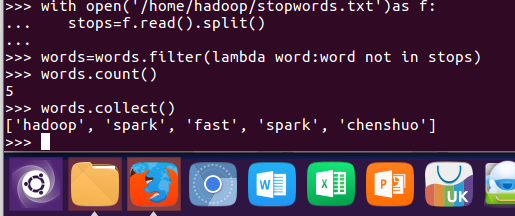
5.去掉停用词
with open('/home/hadoop/stopwords.txt') as f:
     stops = f.read().split()

words = words.filter(lambda word:word not in stops)
words.count()
words.collect()
6.转换成键值对 map()
words = words.map(lambda word:(word,1))

7.统计词频 reduceByKey()
words = words.reduceByKey(lambda a,b:a+b)

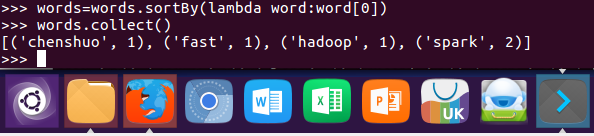
8.按字母顺序排序 sortBy(f)
words = words.sortBy(lambda word:word[0])
words.collect()
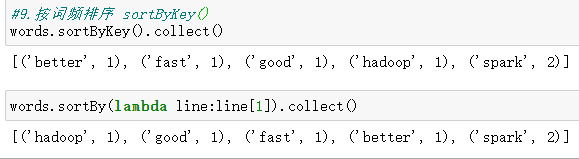
9.按词频排序 sortByKey()
words=words.sortByKey()
words.collect()
# 或者用sortBy(f)
words = words.sortBy(lambda word:word[1])
words.collect()

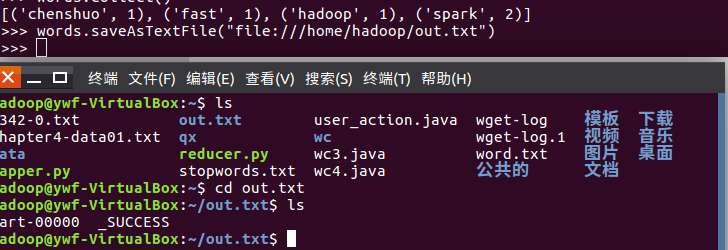
10.结果文件保存 saveAsTextFile(out_url)
words.saveAsTextFile("file:///home/hadoop/out.txt")
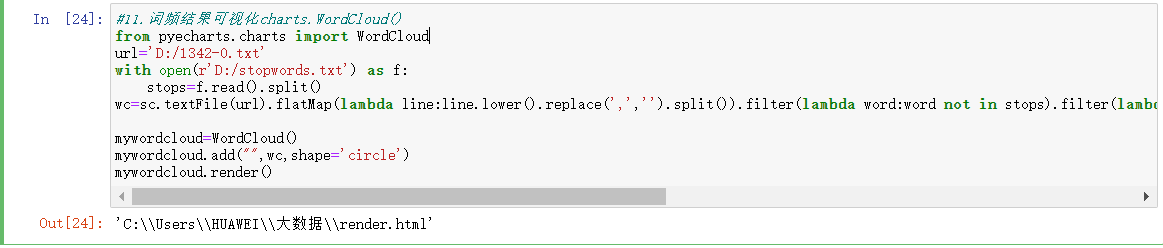
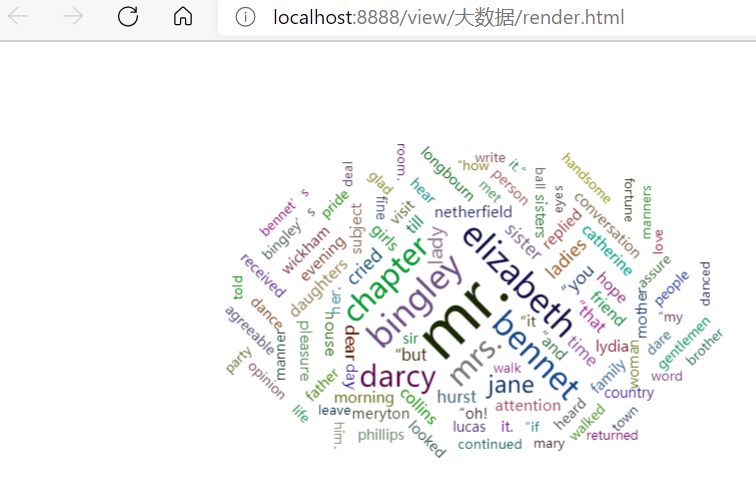
11.词频结果可视化charts.WordCloud()
#11.词频结果可视化charts.WordCloud()
from pyecharts.charts import WordCloud
url='D:/1342-0.txt'
with open(r'D:/stopwords.txt') as f:
    stops=f.read().split()
wc=sc.textFile(url).flatMap(lambda line:line.lower().replace(',','').split()).filter(lambda word:word not in stops).filter(lambda word:len(word)>2).map(lambda word:(word,1)).reduceByKey(lambda a,b:a+b).sortBy(lambda x:x[1],False).take(100)

mywordcloud=WordCloud()
mywordcloud.add("",wc,shape='circle')
mywordcloud.render()
二、学生课程分数案例
lines = sc.textFile('file:///home/hadoop/chapter4-data01.txt')
lines.take(5)

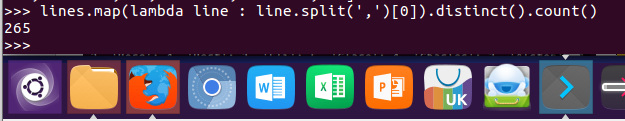
1.总共有多少学生?map(), distinct(), count()
lines.map(lambda line : line.split(',')[0]).distinct().count()
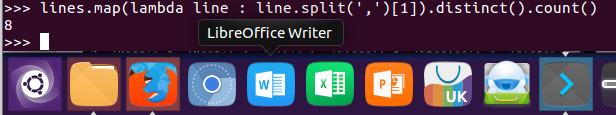
2.开设了多少门课程?
lines.map(lambda line : line.split(',')[1]).distinct().count()
3.每个学生选修了多少门课?map(), countByKey()
lines.map(lambda line : line.split(',')).map(lambda line:(line[0],(line[1],line[2]))).countByKey()
# 或者 map(),countByValue()

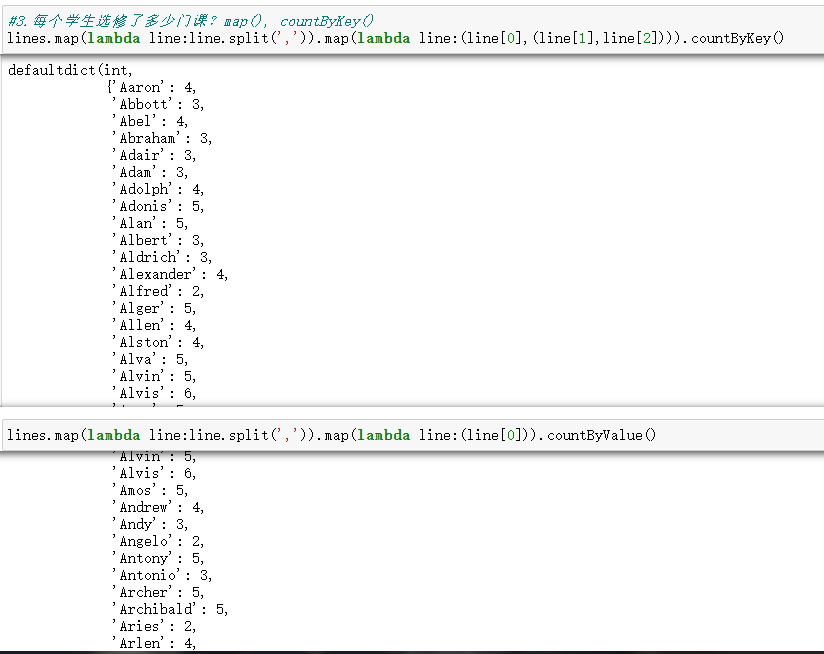
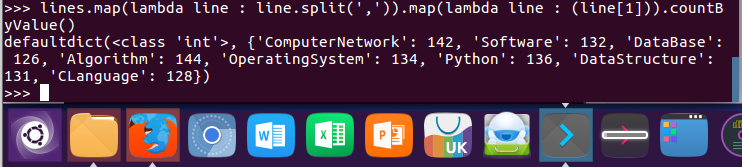
4.每门课程有多少个学生选?map(), countByValue()
lines.map(lambda line : line.split(',')).map(lambda line : (line[1])).countByValue()
# 或者 map(),countByKey()
lines.map(lambda line:line.split(',')).map(lambda line:(line[1],(line[0],line[2]))).countByKey()

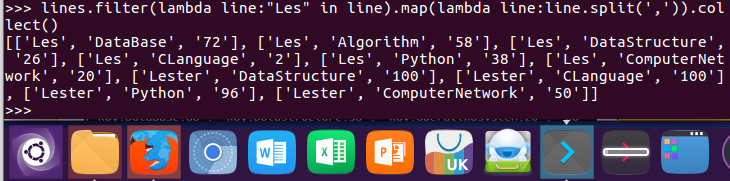
5.Les选修了几门课?每门课多少分?filter(), map() RDD
lines.filter(lambda line:"Les" in line).map(lambda line:line.split(',')).collect()
6.Les选修了几门课?每门课多少分?map(),lookup() list
lines.map(lambda line:line.split(',')).map(lambda line:(line[0],line[1])).lookup("Les")
lines.map(lambda line:line.split(',')).map(lambda line:(line[0],line[2])).lookup("Les")

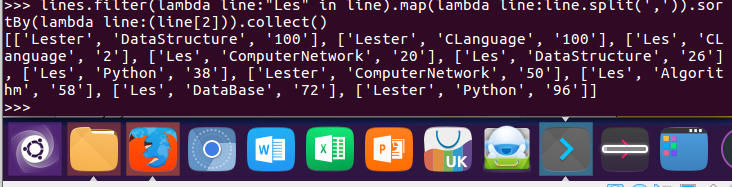
7.Les的成绩按分数大小排序。filter(), map(), sortBy()
lines.filter(lambda line:"Les" in line).map(lambda line:line.split(',')).sortBy(lambda line:(line[2])).collect()
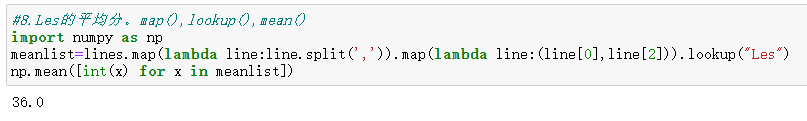
8.Les的平均分。map(),lookup(),mean()
import numpy as np
meanlist=lines.map(lambda line:line.split(',')).map(lambda line:(line[0],line[2])).lookup("Les")
np.mean([int(x) for x in meanlist])
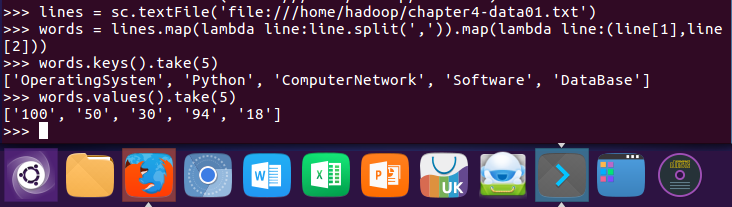
9.生成(课程,分数)RDD,观察keys(),values()
lines = sc.textFile('file:///home/hadoop/chapter4-data01.txt')
words = lines.map(lambda line:line.split(',')).map(lambda line:(line[1],line[2]))
words.keys().take(5)
words.values().take(5)
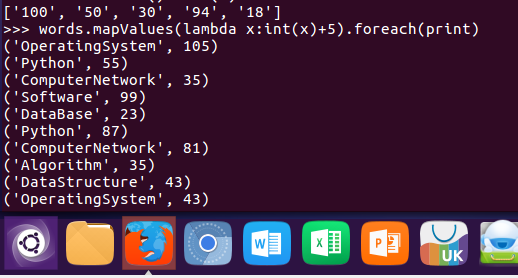
10.每个分数+5分。mapValues(func)
words.mapValues(lambda x:int(x)+5).foreach(print)
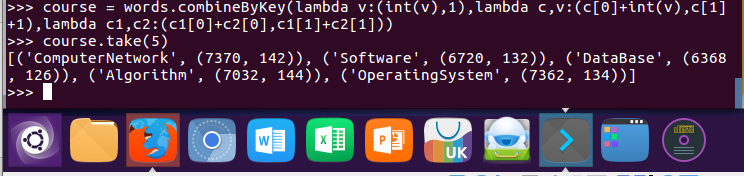
11.求每门课的选修人数及所有人的总分。combineByKey()
course = words.combineByKey(lambda v:(int(v),1),lambda c,v:(c[0]+int(v),c[1]+1),lambda c1,c2:(c1[0]+c2[0],c1[1]+c2[1]))
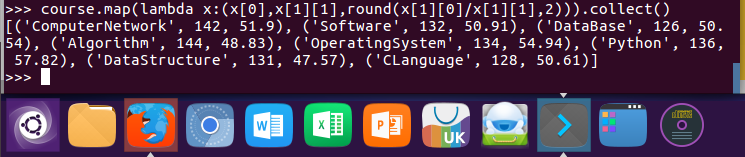
12.求每门课的选修人数及平均分,精确到2位小数。map(),round()
course.map(lambda x:(x[0],x[1][1],round(x[1][0]/x[1][1],2))).collect()
13.求每门课的选修人数及平均分。用reduceByKey()实现,并比较与combineByKey()的异同。
lines.map(lambda line:line.split(',')).map(lambda x:(x[1],(int(x[2]),1))).reduceByKey(lambda a,b:(a[0]+b[0],a[1]+b[1])).foreach(print)

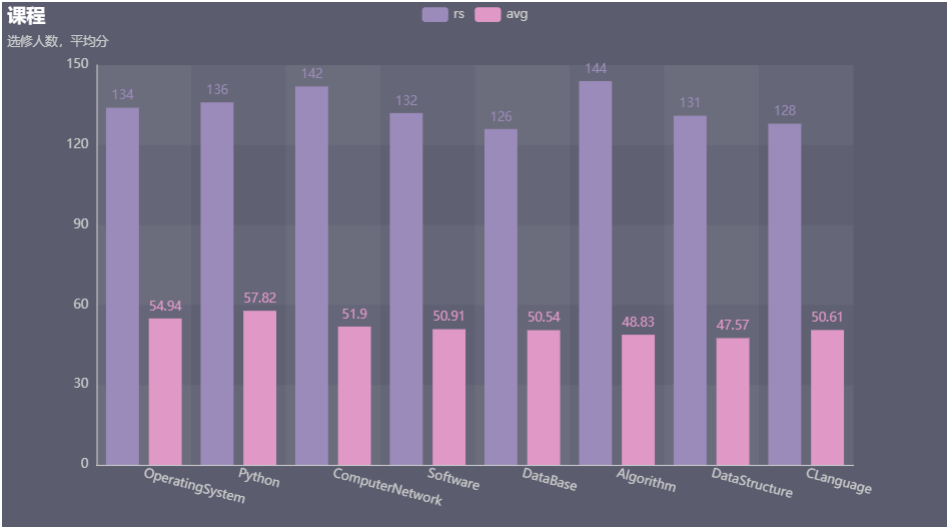
14.结果可视化。charts,Bar()
from pyecharts.charts import Bar
from pyecharts import options as opts

bar = Bar()
bar.add_xaxis(cs.keys().collect())
bar.add_yaxis('avg',cs.map(lambda x:x[2]).collect())
bar.set_global_opts()
bar.render_notebook()

from pyecharts.charts import Bar
from pyecharts import options as opts
from pyecharts.globals import ThemeType
bar = Bar(init_opts=opts.InitOpts(theme=ThemeType.PURPLE_PASSION))
bar.add_xaxis(cs.keys().collect())
bar.add_yaxis('rs',cs.map(lambda x:x[1]).collect())
bar.add_yaxis('avg',cs.map(lambda x:x[2]).collect())

bar.set_global_opts(title_opts=opts.TitleOpts(title="课程", subtitle="选修人数,平均分"),
                    xaxis_opts=opts.AxisOpts(axislabel_opts=opts.LabelOpts(rotate=-15)),
                    yaxis_opts=opts.AxisOpts(max_=150))

bar.render_notebook()