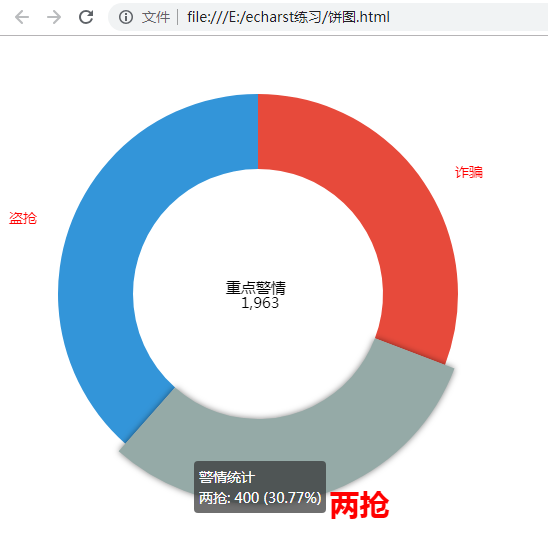
<!DOCTYPE html>
<html lang="en">
<head>
    <meta charset="UTF-8">
    <meta name="viewport" content="width=device-width, initial-scale=1.0">
    <title>Document</title>
    <script src="./echarts.min.js"></script>
</head>
<body>
    <div id="a" style=" 500px; height: 500px;"></div>
</body>
<script>

    var myChart = echarts.init(document.getElementById('a'))

        option = {
            tooltip: {
                trigger: 'item',
                formatter: '{a} <br/>{b}: {c} ({d}%)'
            },
            //饼图中间显示文字
            graphic:{
                type:'text',
                left:'center',
                top:'center',
                style:{
                    text:"重点警情
 1,963",//
是换行
                    textAlign:'center', //字体居中
                    fill:'#000',    //字体颜色
                    fontSize:15     //字体大小
                }

            },
            legend: {
                orient: 'vertical',
                left: 10,
                show:false
            },
            grid:{
                show:false,
                // 距离头部的距离
                top:'10%',
                left:'10%',
                // x2:'90%',
                // 距离底部的距离
                bottom:'15%',
                // 修改y轴文字样式
                textStyle:{
                    fontSize: 12,//字体大小
                    color: '#fff'//字体颜色
                },

            } ,
            series: [
                {
                    name: '警情统计',
                    type: 'pie',
                    radius: ['50%', '80%'],
                    avoidLabelOverlap: false,
                    label: {
                        show: false,
                        position: 'center'
                    },
                    emphasis: {
                        label: {
                            show: true,
                            fontSize: '30',
                            fontWeight: 'bold'
                        }
                    },
                    labelLine: {
                        show: true
                    },
                    // 图外样式
                    itemStyle: {

                        emphasis: {
                            shadowBlur: 10,
                            shadowOffsetX: 0,
                            shadowColor: 'rgba(0, 0, 0, 0.5)'
                        },
                        // 这里做改变
                       normal:{   //正常样式
                        //    标签
                            label:{
                                show: true,
                                // 显示数据名称以及具体的数据
                                // formatter: '{b} : {c} ({d}%)' ,
                                // 只显示数据名称
                                formatter: '{b}',
                                fontSize: '14',
                                color:'red',
                            },
                            labelLine :{
                                show:false
                            }
                        }
                    },
                     color:['#E74A3B','#889B98','#3395D9'],
                    data: [
                        {value: 400, name: '诈骗 '},
                        {value: 400, name:'两抢'},
                        {value: 500, name: '盗抢'},

                    ]
                }
            ]
        }

myChart.setOption(option)
window.onresize=function(){
    myChart.resize()
}
</script>
</html>