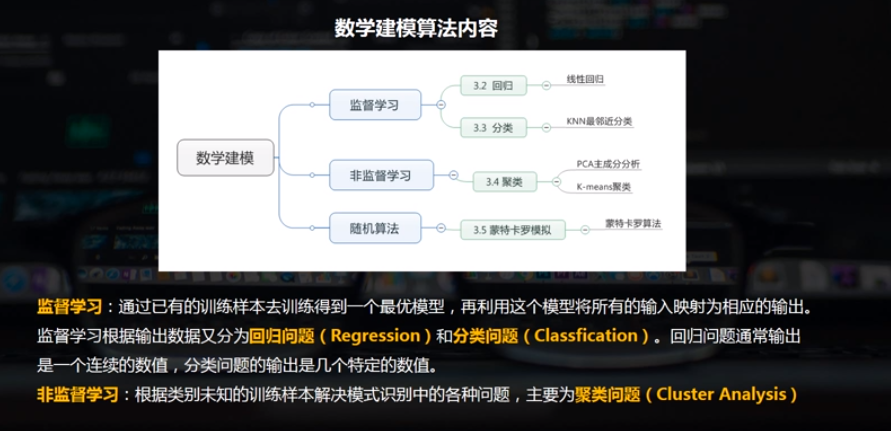
数学建模概述
1.回归分析
在统计学中,回归分析(regression analysis)指的是确定两种或两种以上变量间互相依赖的定量关系的一种统计分析方法。
按照自变量和因变量之间的关系类型,可分为线性回归分析和非线性回归分析。



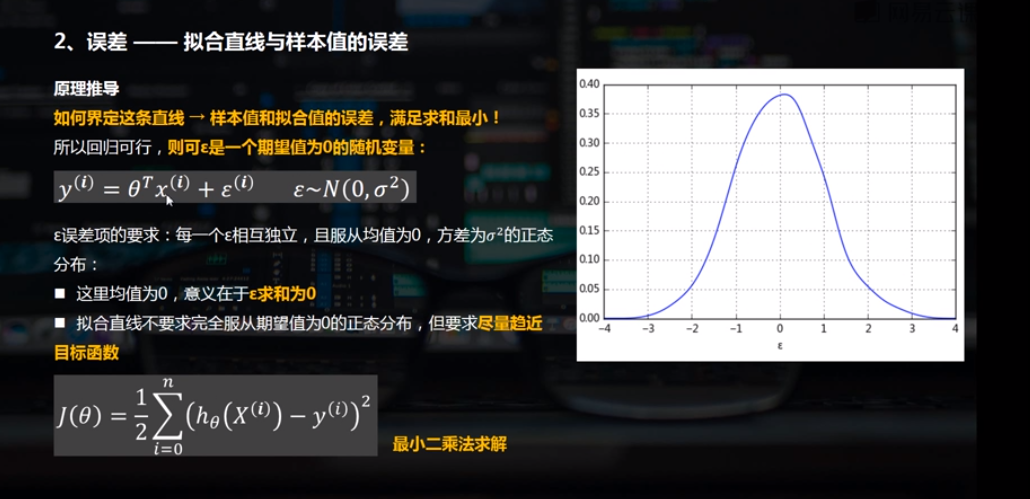
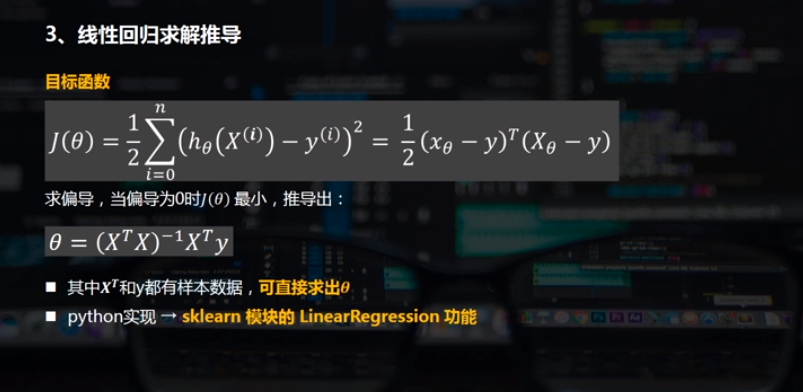
2.线性回归的python实现
线性回归的python实现方法
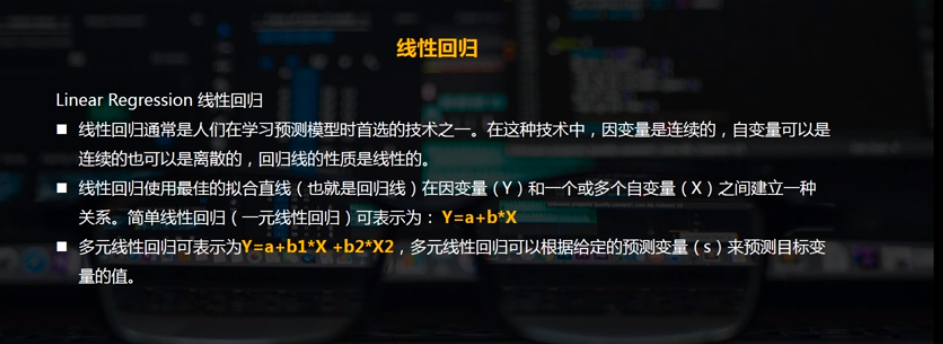
线性回归通常是人们在学习预测模型时首选的技术之一。在这种技术中,因变量是连续的,自变量可以是连续的也可以是离散的,回归线的性质是线性的。
线性回归使用最佳的拟合直线(也就是回归线)在因变量(Y)和一个或多个自变量(X)之间建立一种关系。
简单线性回归 / 多元线性回归
2.1 简单线性回归 (一元线性回归)
(1)示例
创建线性回归模型:
model = LinearRegression()
model.fit(xtrain[:, np.newaxis], ytrain)
model.coef_斜率的参数  、 model.intercept_ 截距的参数
拟合测试:
xtest = np.linspace(0, 10, 1000) #测试值、根据拟合曲线求出 ytest = model.predict(xtest[:, np.newaxis])
import numpy as np
import pandas as pd
import matplotlib.pyplot as plt
% matplotlib inline
# 简单线性回归(一元线性回归)
# (1)数据示例

from sklearn.linear_model import LinearRegression
# 导入线性回归模块

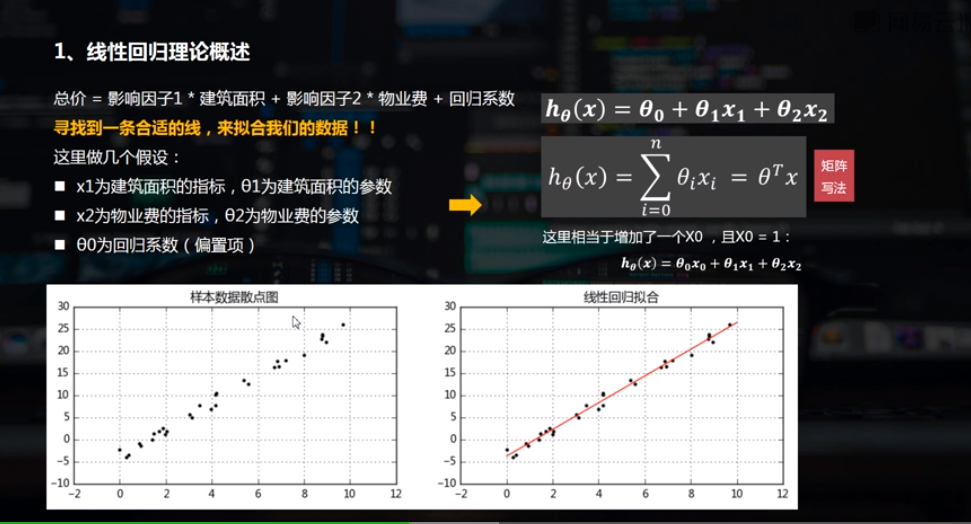
rng = np.random.RandomState(1)  #选择随机数里边的种子1
xtrain = 10 * rng.rand(30)
ytrain = 8 + 4 * xtrain + rng.rand(30)
# np.random.RandomState → 随机数种子,对于一个随机数发生器,只要该种子(seed)相同,产生的随机数序列就是相同的
# 生成随机数据x与y
# 样本关系:y = 8 + 4*x

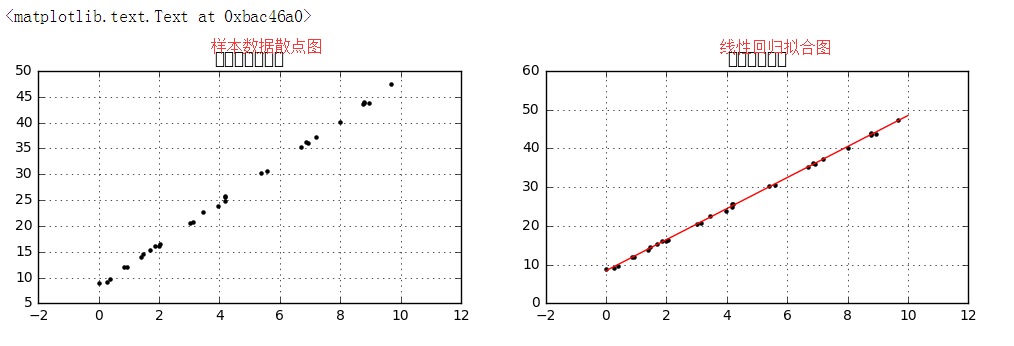
fig = plt.figure(figsize =(12,3))
ax1 = fig.add_subplot(1,2,1)
plt.scatter(xtrain,ytrain,marker = '.',color = 'k')
plt.grid()
plt.title('样本数据散点图')
# 生成散点图

model = LinearRegression() #创建线性回归模型
model.fit(xtrain[:, np.newaxis], ytrain) #填上值自变量和因变量,如果是多元线性回归自变量给它个矩阵就可以了,model.fit(xtrain, ytrain)这样子是不行的,要把它转置为列的值,
# xtrain.shape #(30,)  # xtrain[:, np.newaxis] #预测结果就会放到这个model里边
# LinearRegression → 线性回归评估器,用于拟合数据得到拟合直线
# model.fit(x,y) → 拟合直线,参数分别为x与y
# x[:,np.newaxis] → 将数组变成(n,1)形状 把xtrain数组变成列排布(30,1)

#print(model.coef_)  #[ 4.00448414]斜率的参数
#print(model.intercept_) #8.44765949943截距的参数

xtest = np.linspace(0, 10, 1000) #测试值
ytest = model.predict(xtest[:, np.newaxis])
# 创建测试数据xtest,并根据拟合曲线求出ytest
# model.predict → 预测

ax2 = fig.add_subplot(1, 2, 2)
plt.scatter(xtrain, ytrain, marker = '.', color = 'k')
plt.plot(xtest, ytest, color = 'r')
plt.grid()
plt.title('线性回归拟合')
# 绘制散点图、线性回归拟合直线
(2)误差
# 简单线性回归(一元线性回归)
# (2)误差

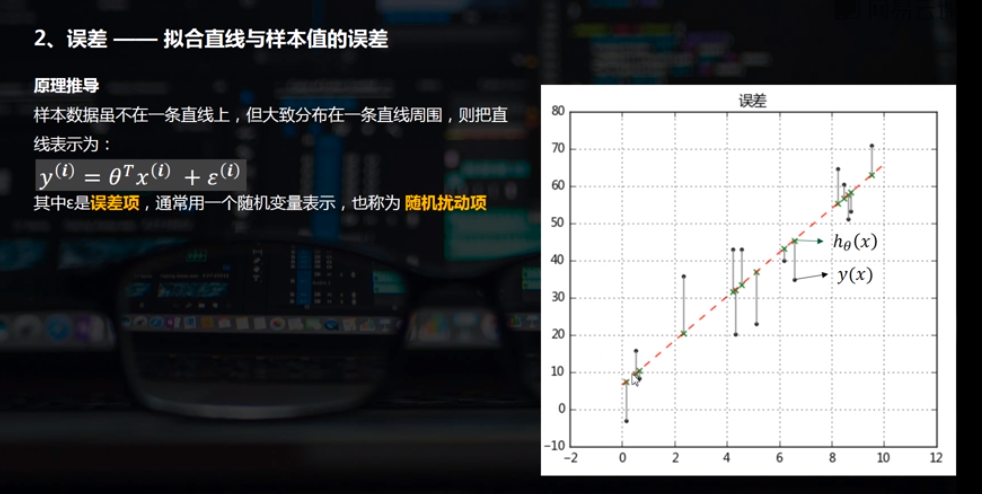
rng = np.random.RandomState(8)
xtrain = 10 * rng.rand(15)
ytrain = 8 + 4 * xtrain + rng.rand(15) * 30
model.fit(xtrain[:,np.newaxis],ytrain)
xtest = np.linspace(0,10,1000)
ytest = model.predict(xtest[:,np.newaxis])
# 创建样本数据并进行拟合

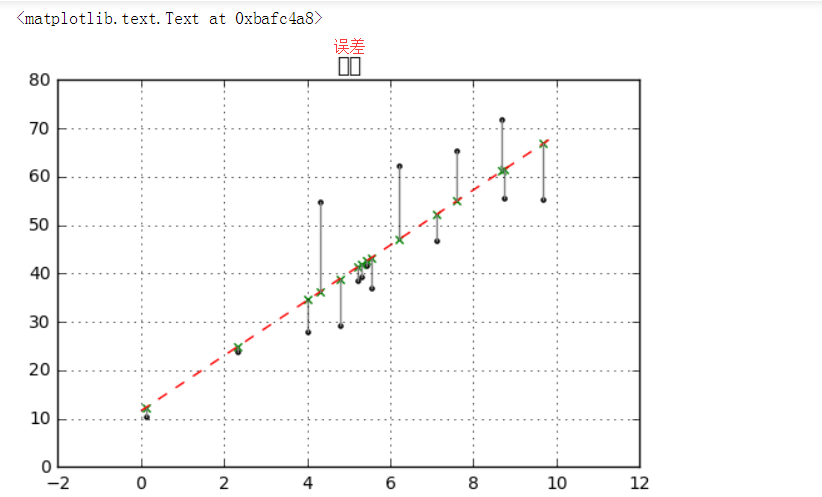
plt.plot(xtest,ytest,color = 'r',linestyle = '--')  # 拟合直线
plt.scatter(xtrain,ytrain,marker = '.',color = 'k')  # 样本数据散点图
ytest2 = model.predict(xtrain[:,np.newaxis])  # 样本数据x在拟合直线上的y值
plt.scatter(xtrain,ytest2,marker = 'x',color = 'g')   # ytest2散点图
plt.plot([xtrain,xtrain],[ytrain,ytest2],color = 'gray')  # 误差线
plt.grid()
plt.title('误差')
# 绘制图表
(3)求解a,b
# 简单线性回归(一元线性回归)
# (3)求解a,b

rng = np.random.RandomState(1)
xtrain = 10 * rng.rand(30)
ytrain = 8 + 4 * xtrain + rng.rand(30)
# 创建数据

model = LinearRegression()
model.fit(xtrain[:,np.newaxis],ytrain)
# 回归拟合

print('斜率a为:%.4f' % model.coef_[0])
print('截距b为:%.4f' % model.intercept_)
print('线性回归函数为:
y = %.4fx + %.4f' % (model.coef_[0],model.intercept_))
# 参数输出

2.2 多元线性回归
model = LinearRegression()
model.fit(df[['b1', 'b2', 'b3', 'b4']], df['y'])
# 多元线性回归

rng = np.random.RandomState(5)
xtrain = 10 * rng.rand(150,4)
ytrain = 20 + np.dot(xtrain ,[1.5,2,-4,3])
df = pd.DataFrame(xtrain, columns = ['b1','b2','b3','b4'])
df['y'] = ytrain
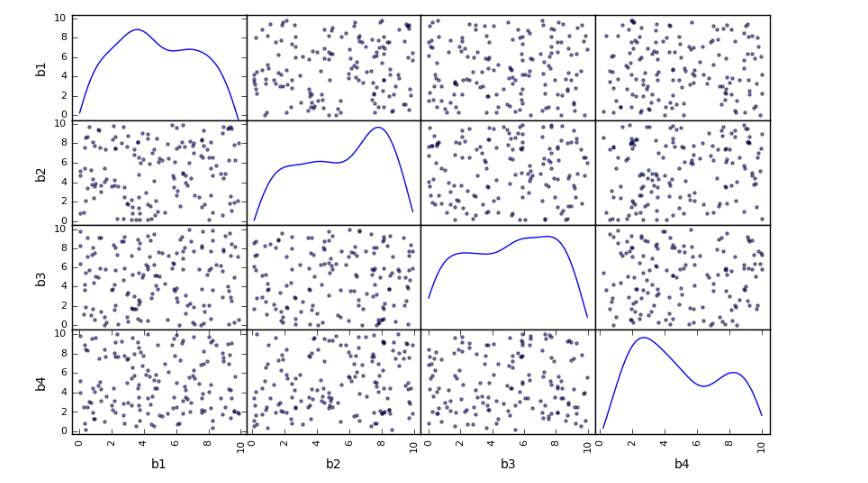
pd.scatter_matrix(df[['b1','b2','b3','b4']],figsize=(10,6),
                 diagonal='kde',
                 alpha = 0.5,
                 range_padding=0.1)
print(df.head())
# 创建数据,其中包括4个自变量
# 4个变量相互独立

model = LinearRegression()
model.fit(df[['b1', 'b2', 'b3', 'b4']], df['y'])
print('斜率a为:', model.coef_)
print('线性回归函数为:
y = %.1fx1 + %.1fx2 + %.1fx3 + %.1fx4 + %.1f'
      % (model.coef_[0],model.coef_[1],model.coef_[2],model.coef_[3],model.intercept_))
# 参数输出

3. 线性回归模型评估

线性回归模型评估
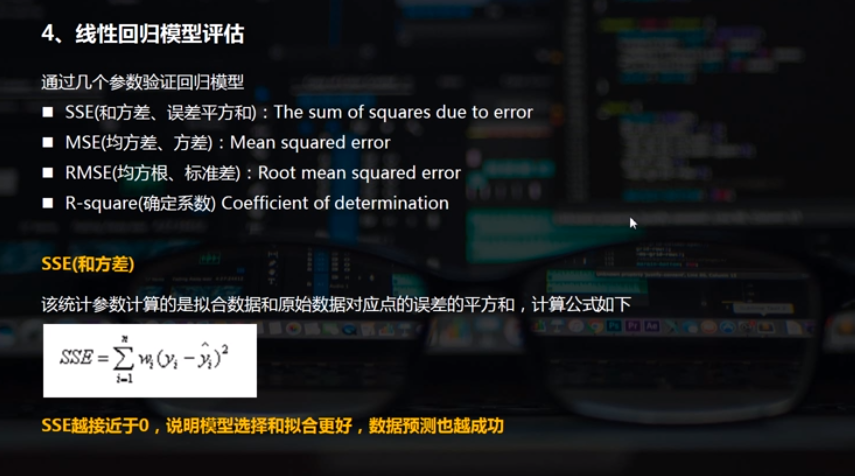
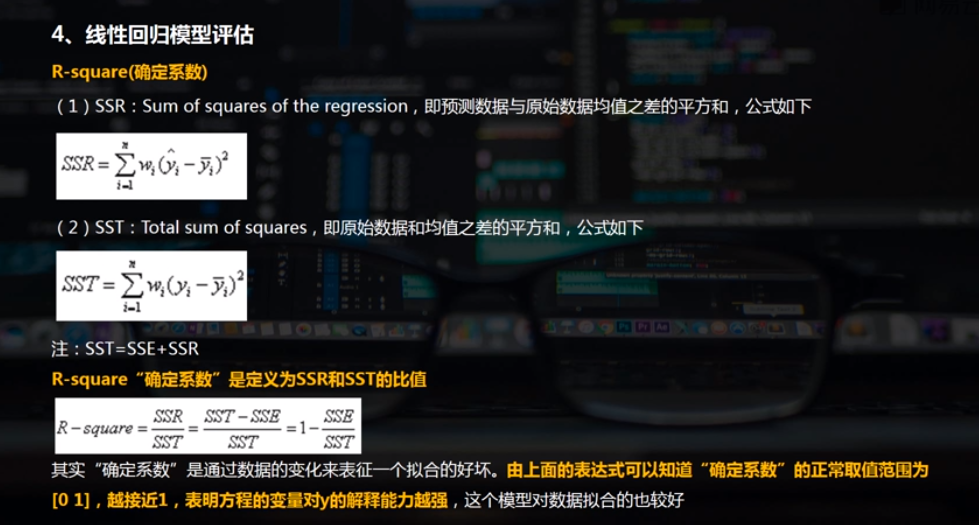
通过几个参数验证回归模型
SSE(和方差、误差平方和):The sum of squares due to error
MSE(均方差、方差):Mean squared error
RMSE(均方根、标准差):Root mean squared error
R-square(确定系数) Coefficient of determination
# 模型评价
# MSE, RMES, R-square

from sklearn import metrics

rng = np.random.RandomState(1)
xtrain = 10 * rng.rand(30)
ytrain = 8 + 4 * xtrain + rng.rand(30) * 3
# 创建数据

model = LinearRegression()
model.fit(xtrain[:,np.newaxis],ytrain)
# 多元回归拟合

ytest = model.predict(xtrain[:,np.newaxis])  # 求出预测数据
mse = metrics.mean_squared_error(ytrain,ytest)  # 求出均方差MSE
rmse = np.sqrt(mse)  # 求出均方根RMSE
print(mse)
print(rmse)

# ssr = ((ytest - ytrain.mean())**2).sum()  # 求出预测数据与原始数据均值之差的平方和
# sst = ((ytrain - ytrain.mean())**2).sum()  # 求出原始数据和均值之差的平方和
# r2 = ssr / sst # 求出确定系数 #0.99464521596949995
r2 = model.score(xtrain[:,np.newaxis],ytrain)  # 求出确定系数 #0.99464521596949995
r2

print("均方差MSE为: %.5f" % mse)
print("均方根RMSE为: %.5f" % rmse)
print("确定系数R-square为: %.5f" % r2)
# 确定系数R-square非常接近于1,线性回归模型拟合较好

总结:
能比较的有两个 R_square '确定系数' 、 MSE,
做两个回归模型可以分别判断哪个MSE更小就好,R哪个接近于1哪个就更好。如果只有一个回归模型,判断是否接近1,只要是大于0.6、0.8就非常不错了。同时在后边做组成成分,假如现在有10个参数,做一个回归模型,做一个R模型评估,比如说为0.85,把这10个参数降维,降维为3个主成分,再做一个3元的线性回归,这个叫回归模型2,为0.92,这个时候我们就选择那个3元的线性回归模型0.92更好,相互比较做出最优比较。
