关于echarts的雷达图比较详细的参数说明
要实现的效果图如下:
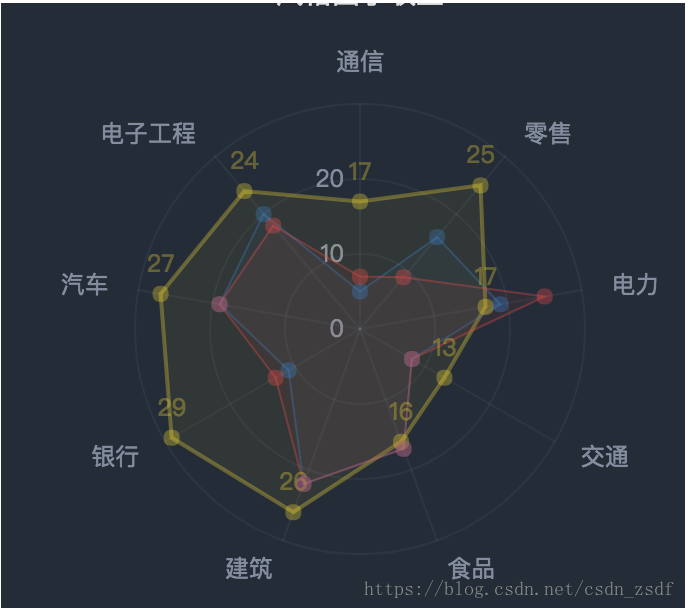
接下来主要关于下面的几个参数进行设置
1. 雷达图的圈数
2. 雷达图每圈上面的数字
3. 雷达图区域拐点的数值
4. 雷达图拐点的样式
5. 雷达图每个区域的颜色设置
6. 雷达图tooltip限制在图表区域内
7. 鼠标可以移动到tooltip里,一般需要在tooltip中加入可操作元素时有用
8. 雷达图背景颜色透明
 export const industryFactorOption = {
    title: {
        text: '雷达图',
        textStyle: {
            color: 'rgba(221,221,221,1)', //标题颜色
            fontSize: 14,
            lineHeight: 20,
        },
        // 标题的位置,此时放在图的底边
        left: 'center',
        top: 'bottom',
    },
    // 图表的位置
    grid: {
        position: 'center',
     },
     tooltip : {
     //雷达图的tooltip不会超出div,也可以设置position属性,position定位的tooltip 不会随着鼠标移动而位置变化,不友好
        confine: true,
        enterable: true, //鼠标是否可以移动到tooltip区域内
     },
    radar: {
        shape: 'circle',
        splitNumber: 3, // 雷达图圈数设置
        name: {
            textStyle: {
                color: '#838D9E',
            },
        },
        // 设置雷达图中间射线的颜色
        axisLine: {
            lineStyle: {
                color: 'rgba(131,141,158,.1)',
                },
        },
        indicator: [{
            name: '通信', max: 30,
            //若将此属性放在radar下,则每条indicator都会显示圈上的数值,放在这儿,只在通信这条indicator上显示
            axisLabel: {
                show: true,
                fontSize: 12,
                color: '#838D9E',
                showMaxLabel: false, //不显示最大值,即外圈不显示数字30
                showMinLabel: true, //显示最小数字,即中心点显示0
            },
        },
        { name: '零售', max: 30},
        { name: '电力', max: 30},
        { name: '交通', max: 30},
        { name: '食品', max: 30},
        { name: '建筑', max: 30},
        { name: '银行', max: 30},
        { name: '汽车', max: 30},
        { name: '电子工程', max: 30},
        ],
        //雷达图背景的颜色,在这儿随便设置了一个颜色,完全不透明度为0,就实现了透明背景
        splitArea : {
            show : false,
            areaStyle : {
                color: 'rgba(255,0,0,0)', // 图表背景的颜色
            },
        },
        splitLine : {
            show : true,
            lineStyle : {
                width : 1,
                color : 'rgba(131,141,158,.1)', // 设置网格的颜色
            },
        },
    },
    series: [{
        name: '雷达图', // tooltip中的标题
        type: 'radar', //表示是雷达图
        symbol: 'circle', // 拐点的样式,还可以取值'rect','angle'等
        symbolSize: 8, // 拐点的大小

        areaStyle: {
            normal: {
                 1,
                opacity: 0.2,
            },
        },
        data: [
            {
                value: [17, 24, 27, 29, 26, 16, 13, 17, 25],
                name: '2018-07',
                // 设置区域边框和区域的颜色
                itemStyle: {
                    normal: {
                        color: 'rgba(255,225,0,.3)',
                        lineStyle: {
                            color: 'rgba(255,225,0,.3)',
                        },
                    },
                },
                //在拐点处显示数值
                label: {
                    normal: {
                        show: true,
                        formatter: (params: any) => {
                            return params.value
                        },
                    },
                },
            },
            {
                value: [5, 20, 19, 11, 22, 17, 8, 19, 16],
                name: '',
                 itemStyle: {
                    normal: {
                        color: 'rgba(60,135,213,.3)',
                        lineStyle: {
                             1,
                            color: 'rgba(60,135,213,.3)',
                        },
                    },
                },
            },
             {
                value: [7, 18, 19, 13, 22, 17, 8, 25, 9],
                name: '',
                itemStyle: {
                    normal: {
                        color: 'rgba(255,74,74,.3)',
                        lineStyle: {
                             1,
                            color: 'rgba(255,74,74,.3)',
                        },
                    },
                },
            },
        ],
    }],
}
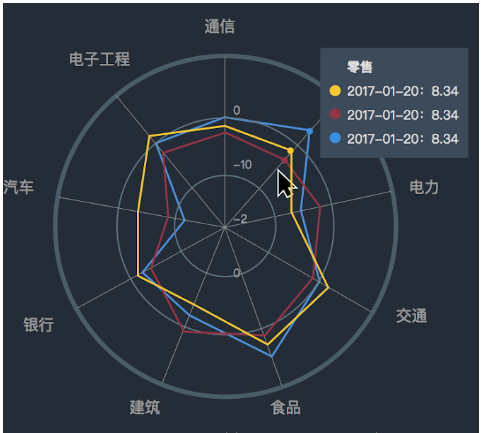
还想实现鼠标移动到indicator上面,显示这条轴上的数据,如下图:见稍后文章
————————————————
版权声明:本文为CSDN博主「画一生情入颜容」的原创文章,遵循CC 4.0 BY-SA版权协议,转载请附上原文出处链接及本声明。
原文链接:https://blog.csdn.net/csdn_zsdf/article/details/81366738