SIR病毒传播模型
https://blog.csdn.net/ylf12341/article/details/89930483
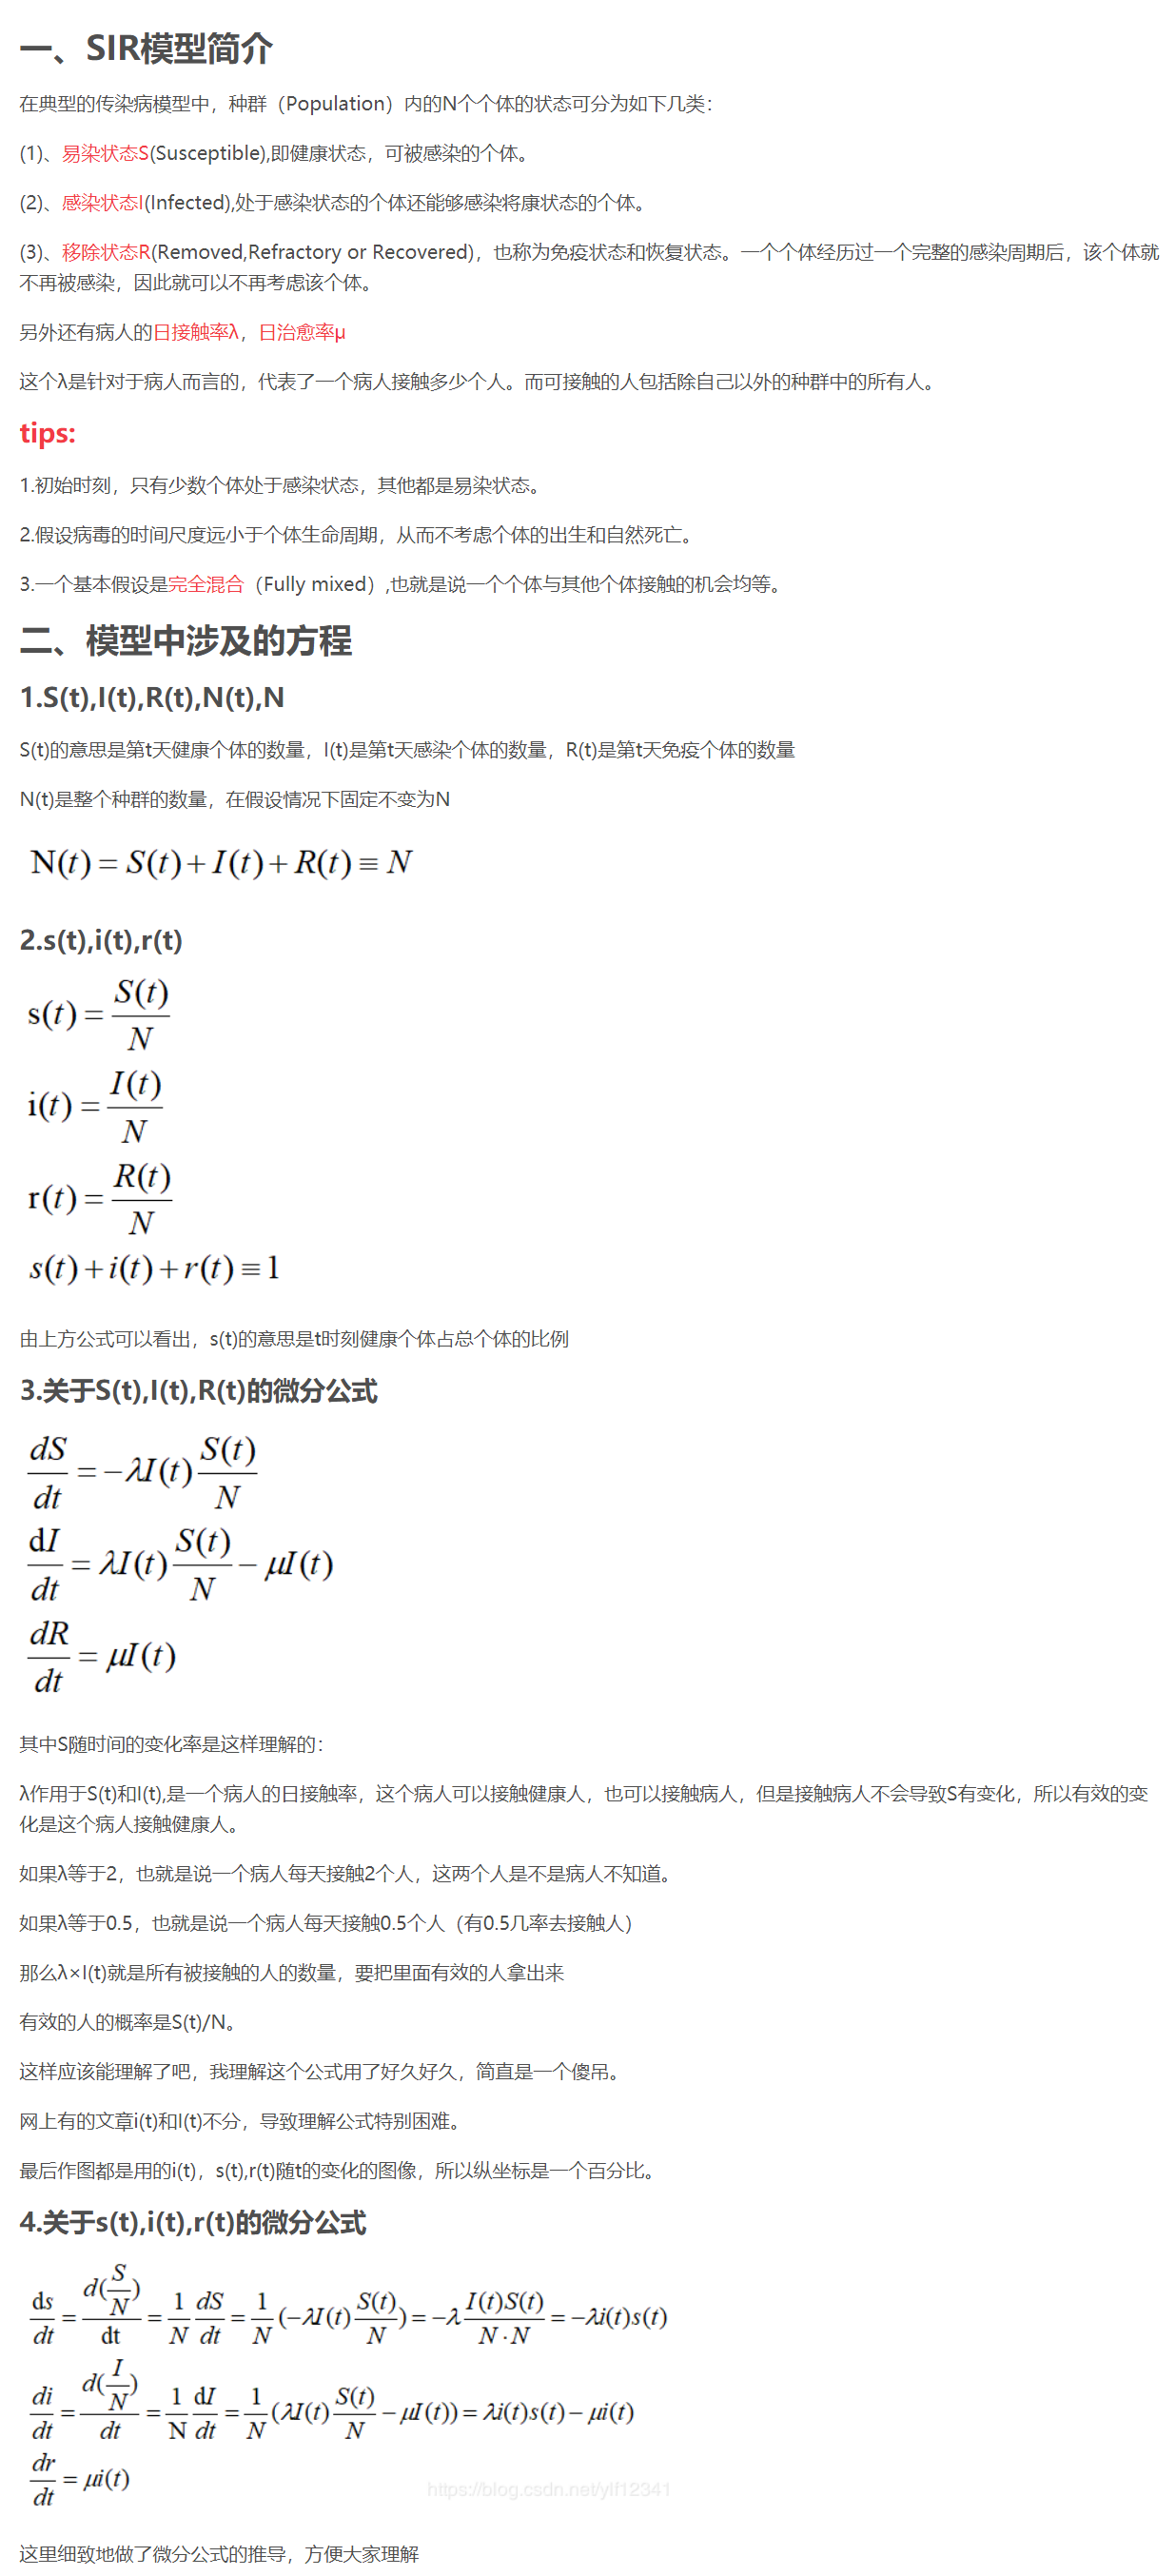
治愈拟合代码:python
import pandas as pd
import numpy as np
import matplotlib.pyplot as plt
import math
def linea_least_squares(x,y):
    xTx = np.dot(x.T,x)
    rel = np.dot(xTx.I, x.T)
    rel = np.dot(rel, y)
    return rel.tolist()

def f(x2):
    return rel[0][0] + rel[1][0]*x2
fr = pd.read_excel('C:/Users/XXX/Desktop/data1.xlsx')
data = np.mat(pd.concat([fr[2],fr[3]], axis=1))
label = np.mat(fr[7]).reshape(len(fr[4]),1)
rel = linea_least_squares(data, label)
sum = 0
x1 = np.linspace(0, 32)
y1 = rel[0] + rel[1]*x1
t = label.reshape(1,len(fr[3]))
t = label.tolist()
for i in range(len(t)):
    sum = sum + abs(t[i][0] - f(i+1))
print(sum)
plt.plot(x1, y1)
plt.title('s = %.5f'% sum)
plt.scatter(np.matrix.tolist(data[:,1]), np.matrix.tolist(label[:,0]))
plt.show()
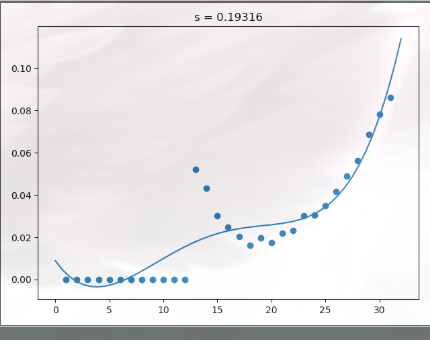
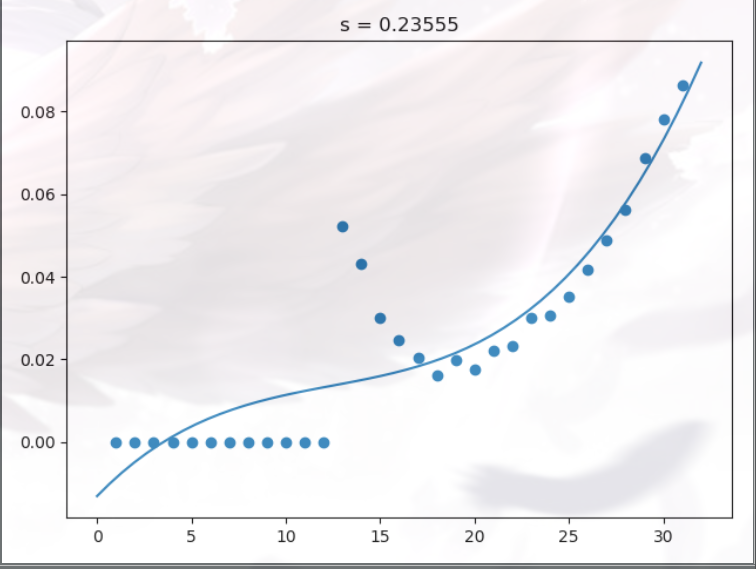
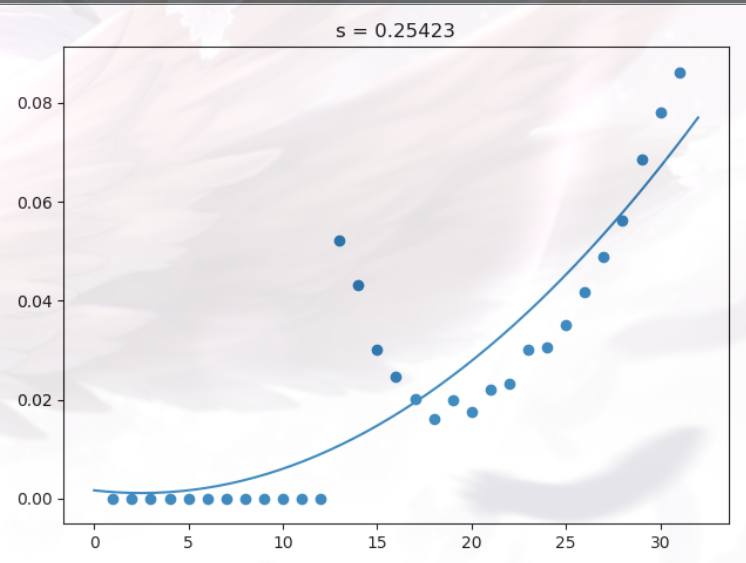
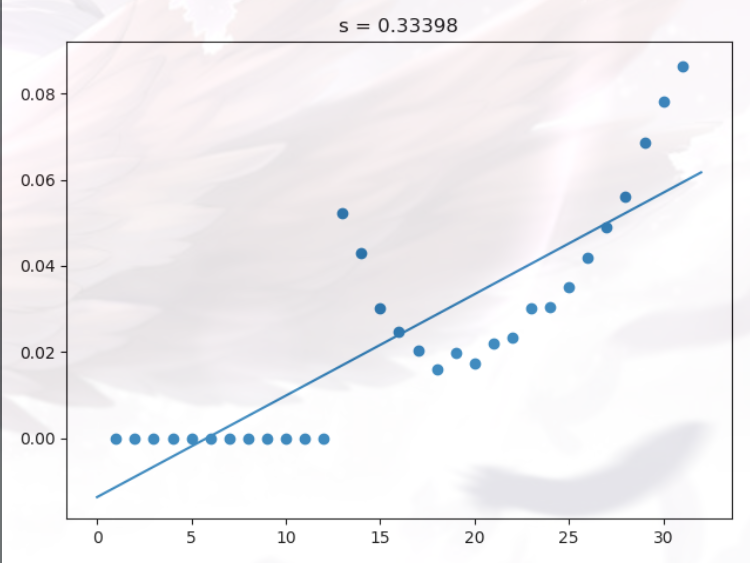
感染拟合
待续....