zoukankan      html  css  js  c++  java
  • 【Openlayers3】在地图上添加highcharts图表

    今天试用了一下ol3,效果很是不错!

    ol3中有个ol.Overlay,使用这个类我们可以在地图中添加各种html要素。
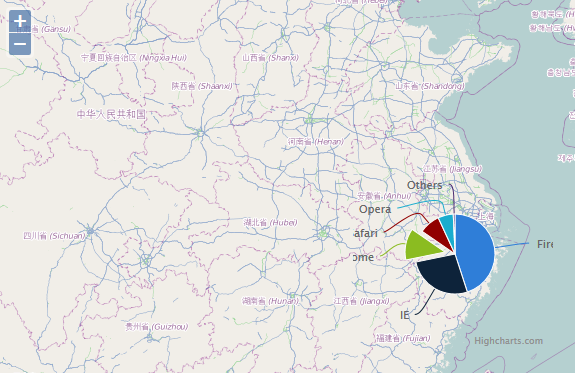
    下面我们在地图中添加一个饼图

    html中添加一个div容器:

     <div style="display: none;">
                <div id='canvasDiv' ></div>
                <div id="popup" title="Welcome to ol3"></div>
            </div>

    canvasDiv绑定到地图中:

     var pie = new ol.Overlay({
                    position: pos,
                    positioning: ol.OverlayPositioning.CENTER_CENTER,
                    element: document.getElementById('canvasDiv')
                });
                map.addOverlay(pie);

    定义饼图,填充canvasDiv:

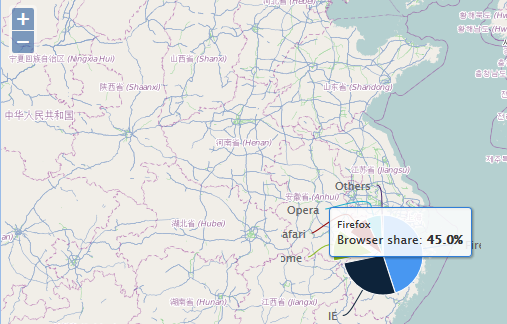
     $(function () {
                        $('#canvasDiv').highcharts({
                            chart: {
                                backgroundColor: 'rgba(255, 255, 255, 0)',
                                plotBorderColor: null,
                                plotBackgroundColor: null,
                                plotBackgroundImage: null,
                                plotBorderWidth: null,
                                plotShadow: false,
                                 200,
                                height: 200,
                            },
                            tooltip: {
                                pointFormat: '{series.name}: <b>{point.percentage:.1f}%</b>'
                            },
                            plotOptions: {
                                pie: {
                                    allowPointSelect: true,
                                    cursor: 'pointer'
                                }
                            },
                            title: {
                                text: ''
                            },
                            dataLabels: {  
                                enabled: false,  
                                color: '#000000',  
                                //distance: -20,  
                                connectorColor: '#000000',  
                                formatter: function() {  
                                    return '<b>'+ this.point.name +'</b>: '+ this.percentage +' %';  
                                }  
      
                            },
                            series: [{
                                type: 'pie',
                                name: 'Browser share',
                                data: [
                                    ['Firefox', 45.0],
                                    ['IE', 26.8],
                                    {
                                        name: 'Chrome',
                                        y: 12.8,
                                        sliced: true,
                                        selected: true
                                    },
                                    ['Safari', 8.5],
                                    ['Opera', 6.2],
                                    ['Others', 0.7]
                                ]
                            }]
                        });
                    });

    效果如下:

  • 相关阅读:
    DirectX 龙书 混合 理解
    火影 雏田
    草帽第十人为什么是甚平
    Agile Development(敏捷开发)
    用例图
    Cache Object Script 学习之二(转载)
    Error link 1107:invalid or corrupt file:can't read at 0x2A8
    孙沈清动词按活用形的分类
    Mac 如何访问linux
    在Mac OS X中配置Apache + PHP + MySQL
  • 原文地址:https://www.cnblogs.com/shitao/p/3376495.html
Copyright © 2011-2022 走看看