纯后台动态生成aspchart ,这种方式没办法实现chart中click事件。click事件点击没有反应,用第二种可以实现点击事件。
两种方式实现同一种效果图: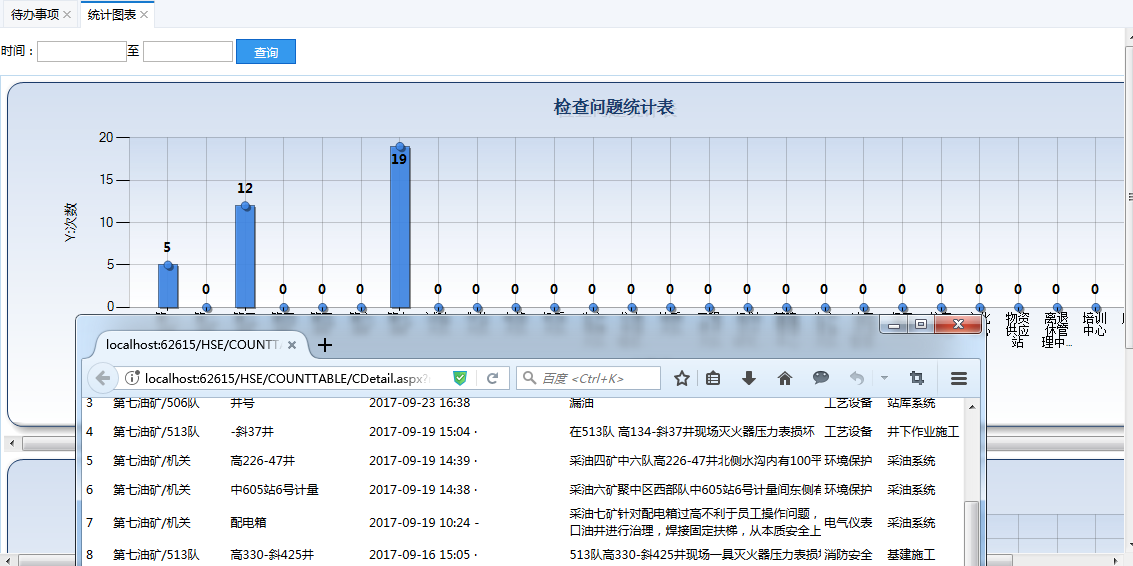
第一种写法:后台动态生成aspchart
前台代码:
<div>
<div class="h_10">
</div>
<table cellpadding="0" cellspacing="1" border="0" width="100%">
<tr>
<td>
时间:<input id="S_BeTime" type="text" class="mycalendar" name="S_BeTime" style=" 90px;" value="" runat="server" />至
<input id="S_EndTime" type="text" class="mycalendar" name="S_EndTime" style=" 90px;" value="" runat="server" />
<asp:Button ID="btnSeach" runat="server" Text="查询" OnClick="btnSeach_Click" class="mybutton" Width="60px" />
</td>
</tr>
</table>
<div id="tab" runat="server"></div>
<div class="h_10">
</div>
<table id="tabMain" runat="server" style=" 100%; height: 700px; text-align: center; vertical-align:text-top; border: 1px solid #BFDAEF;">
</table>
</div>
后台代码:
using System;
using System.Collections.Generic;
using System.Data;
using System.Drawing;
using System.Linq;
using System.Web;
using System.Web.UI;
using System.Web.UI.DataVisualization.Charting;
using System.Web.UI.HtmlControls;
using System.Web.UI.WebControls;

namespace WebForm.HSE.COUNTTABLE
{
    public partial class CIndex : Common.BasePage
    {
        RoadFlow.Platform.Organize mc = new RoadFlow.Platform.Organize();
        RoadFlow.Platform.HSE_VIS_CHECKBLL HSEBLL = new RoadFlow.Platform.HSE_VIS_CHECKBLL();
        private string parentID = "04f12beb-d99d-43df-ac9a-3042957d6bda";//厂的父节点id
        RoadFlow.Platform.Organize ORGBLL = new RoadFlow.Platform.Organize();
        protected void Page_Load(object sender, EventArgs e)
        {
            if (!IsPostBack)
            {
                BindData();
            }
        }


        protected void btnSeach_Click(object sender, EventArgs e)
        {
            BindData();
        }

        private void BindData()
        {
            string strSql = CreateStrWhere();
            DataSet ds = HSEBLL.GetList(strSql);

            DataTable BindCharDtOne = new DataTable();//绑定图表的dt 检查问题明细
            BindCharDtOne.Columns.Add("DeptName");//部门姓名
            BindCharDtOne.Columns.Add("Colum");//数量

            DataTable BindCharDtTwo = new DataTable();//绑定图表的dt 未整改
            BindCharDtTwo.Columns.Add("DeptName");//部门姓名
            BindCharDtTwo.Columns.Add("Colum");//数量

            List<RoadFlow.Data.Model.Organize> ORGModel = ORGBLL.GetChilds(parentID.ToGuid());
            for (int i = 0; i < ORGModel.Count; i++)
            {
                string orgid= ORGModel[i].ID.ToString();
                string orgname = ORGModel[i].Name.ToString();
                //检查问题数
                int countOne = SortDataTable(ds.Tables[0], " CK_CKORG ='" + orgid + "' and (CK_ISFLOW ='1' or CK_ISFLOW='2')", "CREATETIME Desc", 2);
                DataRow drOne;
                drOne = BindCharDtOne.NewRow();
                drOne["DeptName"] = orgname;
                drOne["Colum"] = countOne.ToString();
                BindCharDtOne.Rows.Add(drOne);

                //未整改数
                int countTwo = SortDataTable(ds.Tables[0], " CK_CKORG ='" + orgid + "' and (CK_ISFLOW ='1' or CK_ISFLOW='2') AND PH_CHECKRELATION ='132ec6dc-7424-4f71-9b79-45b70f000644'", "CREATETIME Desc", 2);
                DataRow drTwo;
                drTwo = BindCharDtTwo.NewRow();
                drTwo["DeptName"] = orgname;
                drTwo["Colum"] = countTwo.ToString();
                BindCharDtTwo.Rows.Add(drTwo);

            }
            DrawTable(BindCharDtOne,"检查问题统计表",0);
            DrawTable(BindCharDtTwo, "未整改问题统计表", 5);
        }
        //画图
        private void DrawTable(DataTable dt,string name,int j)
        {
            HtmlTableRow tbRow = new HtmlTableRow();
            HtmlTableCell tbCell = new HtmlTableCell();
            tbCell.VAlign = "Top";
            tbCell.Align = "center";
            Chart Chart1 = new Chart();


            Chart1.Click += new ImageMapEventHandler(Chart1_Click);


            Chart1.BackColor = Color.FromArgb(211, 223, 240);
            Chart1.Height = 356;
            Chart1.Width = 1224;
            Chart1.BorderlineDashStyle = ChartDashStyle.Solid;
            Chart1.BackGradientStyle = GradientStyle.TopBottom;
            Chart1.BorderlineColor = Color.FromArgb(26, 59, 105);
            Chart1.IsSoftShadows = false;


            BorderSkin bdsk = new BorderSkin();
            bdsk.SkinStyle = BorderSkinStyle.Emboss;
            Chart1.BorderSkin = bdsk;

            Series series = new Series("columSeries");   //实例Series 集合 对象
            series.ChartType = SeriesChartType.Column;
            series.XValueType = ChartValueType.Double;
            //Series的边框颜色
            series.BorderColor = Color.FromArgb(180, 26, 59, 105);
            //线条宽度
            series.BorderWidth = 1;
            //线条阴影颜色
            series.ShadowColor = Color.Black;
            //阴影宽度
            series.ShadowOffset = 2;
            //是否显示数据说明
            series.IsVisibleInLegend = true;
            //线条上数据点上是否有数据显示
            series.IsValueShownAsLabel = true;
            //线条上的数据点标志类型
            series.MarkerStyle = MarkerStyle.Circle;
            //线条数据点的大小
            series.MarkerSize = 8;
            //鼠标悬停显示内容
            series.ToolTip = "单位:#AXISLABEL \n次数:#VAL";
            //设置柱子的宽度
            series.CustomProperties = "PointWidth=0.5";
            Font sf = new Font("微软雅黑", 10F, FontStyle.Bold);
            series.Font = sf;

            //线条颜色
            //线条颜色
            switch (j)
            {
                case 0:
                    series.Color = Color.FromArgb(220, 65, 140, 240);
                    break;
                case 1:
                    series.Color = Color.FromArgb(220, 224, 64, 10);
                    break;
                case 3:
                    series.Color = Color.FromArgb(220, 120, 150, 20);
                    break;
                case 4:
                    series.Color = Color.FromArgb(220, 120, 130, 40);
                    break;
                case 5:
                    series.Color = Color.FromArgb(220, 120, 190, 120);
                    break;
                case 6:
                    series.Color = Color.FromArgb(220, 120, 140, 29);
                    break;
                case 7:
                    series.Color = Color.FromArgb(220, 120, 150, 20);
                    break;
                case 8:
                    series.Color = Color.FromArgb(220, 120, 150, 20);
                    break;
                case 9:
                    series.Color = Color.FromArgb(220, 120, 150, 20);
                    break;
            }
            ////设置图表Y轴对应项
            series.YValueMembers = "Colum";
            ////设置图表X轴对应项
            series.XValueMember = "DeptName";
            series.PostBackValue = "#AXISLABEL";
            Chart1.Series.Add(series);


            ChartArea area = new ChartArea("columArea");   //实例 ChartArea 对象

            //背景色
            area.BackColor = Color.FromArgb(64, 165, 191, 228);
            //背景渐变方式
            area.BackGradientStyle = GradientStyle.TopBottom;
            //渐变和阴影的辅助背景色
            area.BackSecondaryColor = Color.White;
            //边框颜色
            area.BorderColor = Color.FromArgb(64, 64, 64, 64);
            //阴影颜色
            area.ShadowColor = Color.Transparent;

            //设置X轴和Y轴线条的颜色和宽度
            area.AxisX.LineColor = Color.FromArgb(64, 64, 64, 64);
            area.AxisX.LineWidth = 1;
            area.AxisY.LineColor = Color.FromArgb(64, 64, 64, 64);
            area.AxisY.LineWidth = 1;

            //设置X轴和Y轴的标题
            area.AxisX.Title = "X:单位";
            area.AxisY.Title = "Y:次数";

            //设置图表区网格横纵线条的颜色和宽度
            area.AxisX.MajorGrid.LineColor = Color.FromArgb(64, 64, 64, 64);
            area.AxisX.MajorGrid.LineWidth = 1;
            area.AxisY.MajorGrid.LineColor = Color.FromArgb(64, 64, 64, 64);
            area.AxisY.MajorGrid.LineWidth = 1;

            area.AxisX.Interval = 1;   //设置X轴坐标的间隔为1
            area.AxisX.IntervalOffset = 1;  //设置X轴坐标偏移为1
            area.AxisX.LabelStyle.Angle = 90;
            area.AxisX.LabelStyle.IsStaggered = false;   //设置是否交错显示,比如数据多的时间分成两行来显示


            area.AxisX.LabelAutoFitStyle = LabelAutoFitStyles.WordWrap;

            //设置X轴文字大小
            area.AxisX.LabelAutoFitMinFontSize = 16;
            area.AxisX.TitleFont = new Font("微软雅黑", 10F, FontStyle.Regular);
            area.AxisY.TitleFont = new Font("微软雅黑", 10F, FontStyle.Regular);
            Chart1.ChartAreas.Add(area);   // 将ChartArea 对象添加到chart 对象中


            //添加标题
            Title tile = new Title();
            tile.Text = string.Format("{0} ", name);
            //标题的字体
            tile.Font = new System.Drawing.Font("Microsoft Sans Serif", 12, FontStyle.Bold);
            //标题字体颜色
            tile.ForeColor = Color.FromArgb(26, 59, 105);
            //标题阴影颜色
            tile.ShadowColor = Color.FromArgb(32, 0, 0, 0);
            //标题阴影偏移量
            tile.ShadowOffset = 3;
            Chart1.Titles.Add(tile);
            //------------


            //设置图表的数据源
            Chart1.DataSource = dt;
            //绑定数据
            Chart1.DataBind();
            Panel pan = new Panel();//显示滚动条的panel
            pan.Width = 1200;
            pan.ScrollBars = ScrollBars.Horizontal;
            pan.Attributes.Add("style", "overflow-y: hidden;");//隐藏Y轴滚动条

            pan.Controls.Add(Chart1);
            tbCell.Controls.Add(pan);

            tbRow.Cells.Add(tbCell);
            this.tabMain.Controls.Add(tbRow);
            this.tab.InnerHtml = "";
        }

        /// <summary>
        /// Handles the Click event of the Chart1 control.
        /// </summary>
        /// <param name="sender">The source of the event.</param>
        /// <param name="e">The <see cref="System.Web.UI.WebControls.ImageMapEventArgs"/> instance containing the event data.</param>
        protected void Chart1_Click(object sender, ImageMapEventArgs e)
        {

            string[] input = e.PostBackValue.Split(':');

        }

        private string CreateStrWhere()
        {
            string strwhere = " 1=1 ";
            string date1 = S_BeTime.Value;
            string date2 = S_EndTime.Value;
            if (date1.IsDateTime())
            {
                strwhere += " AND CK_TIME >=to_date('" + date1.ToDateTime().ToString("yyyy-MM-dd 00:00:00") + "','yyyy-mm-dd hh24:mi:ss')";

            }

            if (date2.IsDateTime())
            {
                strwhere += " AND CK_TIME <=to_date('" + date2.ToDateTime().AddDays(1).ToString("yyyy-MM-dd 00:00:00") + "','yyyy-mm-dd hh24:mi:ss')";

            }
            strwhere += "  order by createtime  desc ";
            return strwhere;
        }


        #region DataTable筛选,排序返回符合条件行组成的新DataTable或直接用DefaultView按条件返回
        /// <summary>
        /// DataTable筛选,排序返回符合条件行组成的新DataTable或直接用DefaultView按条件返回
        /// eg:SortExprDataTable(dt,"Sex='男'","Time Desc",1)
        /// </summary>
        /// <param name="dt">传入的DataTable</param>
        /// <param name="strExpr">筛选条件</param>
        /// <param name="strSort">排序条件</param>
        /// <param name="mode">1,直接用DefaultView按条件返回,效率较高;2,DataTable筛选,排序返回符合条件行组成的新DataTable</param>
        public int SortDataTable(DataTable dt, string strExpr, string strSort, int mode)
        {
            int Count = 0;
            switch (mode)
            {
                case 1:
                    //方法一 直接用DefaultView按条件返回
                    dt.DefaultView.RowFilter = strExpr;
                    dt.DefaultView.Sort = strSort;
                    Count = dt.Rows.Count;
                    return Count;
                case 2:
                    //方法二 DataTable筛选,排序返回符合条件行组成的新DataTable
                    DataTable dt1 = new DataTable();
                    DataRow[] GetRows = dt.Select(strExpr, strSort);
                    //复制DataTable dt结构不包含数据
                    dt1 = dt.Clone();
                    foreach (DataRow row in GetRows)
                    {
                        dt1.Rows.Add(row.ItemArray);
                    }
                    Count = dt1.Rows.Count;
                    return Count;
                default:
                    return Count;
            }
        }
        #endregion
    }

}
第二种写法:前台代码编写asp:chart,后台写代码,并实现点击事件Click
前台代码:2个chart
<form id="form1" runat="server"> <div> <div class="h_10"> </div> <table cellpadding="0" cellspacing="1" border="0" width="100%"> <tr> <td>时间:<input id="S_BeTime" type="text" class="mycalendar" name="S_BeTime" style=" 90px;" value="" runat="server" />至 <input id="S_EndTime" type="text" class="mycalendar" name="S_EndTime" style=" 90px;" value="" runat="server" /> <asp:Button ID="btnSeach" runat="server" Text="查询" OnClick="btnSeach_Click" class="mybutton" Width="60px" /> </td> </tr> </table> <div id="tab" runat="server"></div> <div class="h_10"> </div> <table id="tabMain" runat="server" style=" 100%; height: 700px; text-align: center; vertical-align: text-top; border: 1px solid #BFDAEF;"> --%> <tr> <td> <asp:Panel runat="server" Width="1200" ScrollBars="Horizontal " Style="overflow-y: hidden;"> <asp:Chart ID="Chart1" Width="1224" runat="server" ImageType="Png" Height="356" BorderlineDashStyle="Solid" BorderlineColor="26, 59, 105" BackGradientStyle="TopBottom" BorderWidth="2" BackColor="211, 223, 240" IsSoftShadows="false" OnClick="Chart1_Click"> <Legends> <asp:Legend BackColor="Transparent" Alignment="Center" Docking="Bottom" Font="Trebuchet MS, 8.25pt, style=Bold" IsTextAutoFit="False" Name="Default" LegendStyle="Row"></asp:Legend> </Legends> <BorderSkin SkinStyle="Emboss"></BorderSkin> <Series> <asp:Series Name="Series1" ChartType="Column" XValueType="Double" BorderColor="180, 26, 59, 105" BorderWidth="1" ShadowColor="Black" ShadowOffset="2" IsVisibleInLegend="true" IsValueShownAsLabel="true" MarkerStyle="Circle" MarkerSize="8" ToolTip="单位:#AXISLABEL \n数量:#VAL" CustomProperties="PointWidth=0.5" ChartArea="ChartArea1" Color="220, 65, 140, 240" YValueMembers="Colum" XValueMember="DeptName"> </asp:Series> </Series> <ChartAreas> <asp:ChartArea Name="ChartArea1" BorderColor="64, 64, 64, 64" BackSecondaryColor="White" BackColor="64, 165, 191, 228" ShadowColor="Transparent" BackGradientStyle="TopBottom"> <AxisX LineColor="64, 64, 64, 64" LineWidth="1" Title="X:单位" Interval="1" IntervalOffset="1" LabelAutoFitStyle="WordWrap"> <MajorGrid LineColor="64, 64, 64, 64" LineWidth="1" /> <LabelStyle Angle="90" IsStaggered="false" /> </AxisX> <AxisY LineColor="64, 64, 64, 64" LineWidth="1" Title="Y:次数"> <MajorGrid LineColor="64, 64, 64, 64" LineWidth="1" /> </AxisY> </asp:ChartArea> </ChartAreas> </asp:Chart> </asp:Panel> </td> </tr> <tr> <td> <asp:Panel runat="server" Width="1200" ScrollBars="Horizontal " Style="overflow-y: hidden;"> <asp:Chart ID="Chart2" Width="1224" runat="server" ImageType="Png" Height="356" BorderlineDashStyle="Solid" BorderlineColor="26, 59, 105" BackGradientStyle="TopBottom" BorderWidth="2" BackColor="211, 223, 240" IsSoftShadows="false" OnClick="Chart2_Click"> <Legends> <asp:Legend BackColor="Transparent" Alignment="Center" Docking="Bottom" Font="Trebuchet MS, 8.25pt, style=Bold" IsTextAutoFit="False" Name="Default" LegendStyle="Row"></asp:Legend> </Legends> <BorderSkin SkinStyle="Emboss"></BorderSkin> <Series> <asp:Series Name="Series2" ChartType="Column" XValueType="Double" BorderColor="180, 26, 59, 105" BorderWidth="1" ShadowColor="Black" ShadowOffset="2" IsVisibleInLegend="true" IsValueShownAsLabel="true" MarkerStyle="Circle" MarkerSize="8" ToolTip="单位:#AXISLABEL \n数量:#VAL" CustomProperties="PointWidth=0.5" ChartArea="ChartArea2" Color="220, 65, 140, 240" YValueMembers="Colum" XValueMember="DeptName"> </asp:Series> </Series> <ChartAreas> <asp:ChartArea Name="ChartArea2" BorderColor="64, 64, 64, 64" BackSecondaryColor="White" BackColor="64, 165, 191, 228" ShadowColor="Transparent" BackGradientStyle="TopBottom"> <AxisX LineColor="64, 64, 64, 64" LineWidth="1" Title="X:单位" Interval="1" IntervalOffset="1" LabelAutoFitStyle="WordWrap"> <MajorGrid LineColor="64, 64, 64, 64" LineWidth="1" /> <LabelStyle Angle="90" IsStaggered="false" /> </AxisX> <AxisY LineColor="64, 64, 64, 64" LineWidth="1" Title="Y:次数"> <MajorGrid LineColor="64, 64, 64, 64" LineWidth="1" /> </AxisY> </asp:ChartArea> </ChartAreas> </asp:Chart> </asp:Panel> </td> </tr> </table> </div> </form>
后台代码:
using System;
using System.Collections.Generic;
using System.Data;
using System.Drawing;
using System.Linq;
using System.Web;
using System.Web.UI;
using System.Web.UI.DataVisualization.Charting;
using System.Web.UI.HtmlControls;
using System.Web.UI.WebControls;


namespace WebForm.HSE.COUNTTABLE
{
    public partial class CTest : Common.BasePage
    {
        RoadFlow.Platform.Organize mc = new RoadFlow.Platform.Organize();
        RoadFlow.Platform.HSE_VIS_CHECKBLL HSEBLL = new RoadFlow.Platform.HSE_VIS_CHECKBLL();
        private string parentID = "04f12beb-d99d-43df-ac9a-3042957d6bda";//厂的父节点id
        RoadFlow.Platform.Organize ORGBLL = new RoadFlow.Platform.Organize();
        protected void Page_Load(object sender, EventArgs e)
        {
            this.Chart1.Series["Series1"].PostBackValue = "#AXISLABEL";
            this.Chart2.Series["Series2"].PostBackValue = "#AXISLABEL";
            if (!IsPostBack)
            {
                BindData();
            }
        }


        protected void btnSeach_Click(object sender, EventArgs e)
        {
            BindData();
        }

        private void BindData()
        {
            string strSql = CreateStrWhere();
            DataSet ds = HSEBLL.GetList(strSql);

            DataTable BindCharDtOne = new DataTable();//绑定图表的dt 检查问题明细
            BindCharDtOne.Columns.Add("DeptName");//部门姓名
            BindCharDtOne.Columns.Add("Colum");//数量

            DataTable BindCharDtTwo = new DataTable();//绑定图表的dt 未整改
            BindCharDtTwo.Columns.Add("DeptName");//部门姓名
            BindCharDtTwo.Columns.Add("Colum");//数量

            List<RoadFlow.Data.Model.Organize> ORGModel = ORGBLL.GetChilds(parentID.ToGuid());
            for (int i = 0; i < ORGModel.Count; i++)
            {
                string orgid = ORGModel[i].ID.ToString();
                string orgname = ORGModel[i].Name.ToString();
                //检查问题数
                int countOne = SortDataTable(ds.Tables[0], " CK_CKORG ='" + orgid + "' and (CK_ISFLOW ='1' or CK_ISFLOW='2')", "CREATETIME Desc", 2);
                DataRow drOne;
                drOne = BindCharDtOne.NewRow();
                drOne["DeptName"] = orgname;
                drOne["Colum"] = countOne.ToString();
                BindCharDtOne.Rows.Add(drOne);

                //未整改数
                int countTwo = SortDataTable(ds.Tables[0], " CK_CKORG ='" + orgid + "' and (CK_ISFLOW ='1' or CK_ISFLOW='2') AND PH_CHECKRELATION ='132ec6dc-7424-4f71-9b79-45b70f000644'", "CREATETIME Desc", 2);
                DataRow drTwo;
                drTwo = BindCharDtTwo.NewRow();
                drTwo["DeptName"] = orgname;
                drTwo["Colum"] = countTwo.ToString();
                BindCharDtTwo.Rows.Add(drTwo);

            }
            DrawOne(BindCharDtOne, "检查问题统计表", 0);
            DrawTwo(BindCharDtTwo, "未整改问题统计表", 5);
        }
        private void DrawOne(DataTable dt, string name, int j)
        {
            double[] yValues = new double[dt.Rows.Count];
            string[] xValues = new string[dt.Rows.Count];
            for (int i = 0; i < dt.Rows.Count; i++)
            {
                yValues[i] = Convert.ToDouble(dt.Rows[i]["Colum"]);
                xValues[i] = dt.Rows[i]["DeptName"].ToString();
            }
            Chart1.Series["Series1"].Points.DataBindXY(xValues, yValues);

            Font sf = new Font("微软雅黑", 10F, FontStyle.Bold);
            Chart1.Series["Series1"].Font = sf;
            Chart1.ChartAreas["ChartArea1"].AxisX.TitleFont = new Font("微软雅黑", 10F, FontStyle.Regular);
            Chart1.ChartAreas["ChartArea1"].AxisY.TitleFont = new Font("微软雅黑", 10F, FontStyle.Regular);
            //添加标题
            Title tile = new Title();
            tile.Text = string.Format("{0} ", name);
            //标题的字体
            tile.Font = new System.Drawing.Font("Microsoft Sans Serif", 12, FontStyle.Bold);
            //标题字体颜色
            tile.ForeColor = Color.FromArgb(26, 59, 105);
            //标题阴影颜色
            tile.ShadowColor = Color.FromArgb(32, 0, 0, 0);
            //标题阴影偏移量
            tile.ShadowOffset = 3;
            Chart1.Titles.Add(tile);


        }
        private void DrawTwo(DataTable dt, string name, int j)
        {
            double[] yValues = new double[dt.Rows.Count];
            string[] xValues = new string[dt.Rows.Count];
            for (int i = 0; i < dt.Rows.Count; i++)
            {
                yValues[i] = Convert.ToDouble(dt.Rows[i]["Colum"]);
                xValues[i] = dt.Rows[i]["DeptName"].ToString();
            }
            Chart2.Series["Series2"].Points.DataBindXY(xValues, yValues);

            Font sf = new Font("微软雅黑", 10F, FontStyle.Bold);
            Chart2.Series["Series2"].Font = sf;
            Chart2.ChartAreas["ChartArea2"].AxisX.TitleFont = new Font("微软雅黑", 10F, FontStyle.Regular);
            Chart2.ChartAreas["ChartArea2"].AxisY.TitleFont = new Font("微软雅黑", 10F, FontStyle.Regular);
            //添加标题
            Title tile = new Title();
            tile.Text = string.Format("{0} ", name);
            //标题的字体
            tile.Font = new System.Drawing.Font("Microsoft Sans Serif", 12, FontStyle.Bold);
            //标题字体颜色
            tile.ForeColor = Color.FromArgb(26, 59, 105);
            //标题阴影颜色
            tile.ShadowColor = Color.FromArgb(32, 0, 0, 0);
            //标题阴影偏移量
            tile.ShadowOffset = 3;
            Chart2.Titles.Add(tile);


        }
        protected void Chart1_Click(object sender, ImageMapEventArgs e)
        {
            string str = Server.UrlEncode(e.PostBackValue.Split(':')[0]);
            string date1 = Server.UrlEncode(S_BeTime.Value);
            string date2 = Server.UrlEncode(S_EndTime.Value);
            BindData();
            Response.Write(" <script   language=javascript> window.open   ( 'CDetail.aspx?name=" + str.ToString() + "&date1=" + date1 + "&date2=" + date2 + "&type=1 ',  '查看详细',   'height=420,   width=900,   top=200,left=270,   toolbar=yes,   menubar=no,   scrollbars=yes,   resizable=no,  location=no,   status=no ') </script> ");

        }
        protected void Chart2_Click(object sender, ImageMapEventArgs e)
        {

            string str = Server.UrlEncode(e.PostBackValue.Split(':')[0]);
            string date1 = Server.UrlEncode(S_BeTime.Value);
            string date2 = Server.UrlEncode(S_EndTime.Value);
            BindData();
            Response.Write(" <script   language=javascript> window.open   ( 'CDetail_NoRepair.aspx?name=" + str.ToString() + "&date1=" + date1 + "&date2=" + date2 + "&type=2 ',  '查看详细',   'height=420,   width=1000,   top=200,left=270,   toolbar=no,   menubar=no,   scrollbars=yes,   resizable=no,  location=no,   status=no ') </script> ");

        }

        private string CreateStrWhere()
        {
            string strwhere = " 1=1 ";
            string date1 = S_BeTime.Value;
            string date2 = S_EndTime.Value;
            if (date1.IsDateTime())
            {
                strwhere += " AND CK_TIME >=to_date('" + date1.ToDateTime().ToString("yyyy-MM-dd 00:00:00") + "','yyyy-mm-dd hh24:mi:ss')";

            }

            if (date2.IsDateTime())
            {
                strwhere += " AND CK_TIME <=to_date('" + date2.ToDateTime().AddDays(1).ToString("yyyy-MM-dd 00:00:00") + "','yyyy-mm-dd hh24:mi:ss')";

            }
            strwhere += "  order by createtime  desc ";
            return strwhere;
        }


        #region DataTable筛选,排序返回符合条件行组成的新DataTable或直接用DefaultView按条件返回
        /// <summary>
        /// DataTable筛选,排序返回符合条件行组成的新DataTable或直接用DefaultView按条件返回
        /// eg:SortExprDataTable(dt,"Sex='男'","Time Desc",1)
        /// </summary>
        /// <param name="dt">传入的DataTable</param>
        /// <param name="strExpr">筛选条件</param>
        /// <param name="strSort">排序条件</param>
        /// <param name="mode">1,直接用DefaultView按条件返回,效率较高;2,DataTable筛选,排序返回符合条件行组成的新DataTable</param>
        public int SortDataTable(DataTable dt, string strExpr, string strSort, int mode)
        {
            int Count = 0;
            switch (mode)
            {
                case 1:
                    //方法一 直接用DefaultView按条件返回
                    dt.DefaultView.RowFilter = strExpr;
                    dt.DefaultView.Sort = strSort;
                    Count = dt.Rows.Count;
                    return Count;
                case 2:
                    //方法二 DataTable筛选,排序返回符合条件行组成的新DataTable
                    DataTable dt1 = new DataTable();
                    DataRow[] GetRows = dt.Select(strExpr, strSort);
                    //复制DataTable dt结构不包含数据
                    dt1 = dt.Clone();
                    foreach (DataRow row in GetRows)
                    {
                        dt1.Rows.Add(row.ItemArray);
                    }
                    Count = dt1.Rows.Count;
                    return Count;
                default:
                    return Count;
            }
        }
        #endregion
    }

}
注意:
this.Chart1.Series["Series1"].PostBackValue = "#AXISLABEL"; 这句话是实现click事件的关键