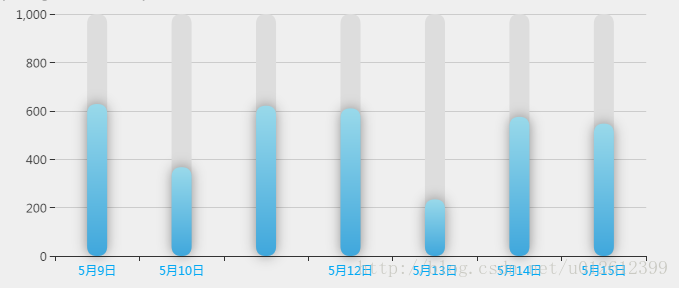
效果图:
var xAxisData = [];
var data = [];
for (var i = 9; i < 16; i++) {
    xAxisData.push('5月' + i + '日');
    data.push(Math.round(Math.random() * 500) + 200);
}
option = {
    title: {
        text: '柱状图示例',
        subtext: 'https://segmentfault.com/q/1010000005137138',
        sublink: 'https://segmentfault.com/q/1010000005137138'
    },
    xAxis: [{
        data: xAxisData.map(function(x){
            if(x == "5月11日")return " ";
            return x;
        }),
        axisLabel: {
            textStyle: {
                color: '#03a9f4'
            }
        },
        splitLine: {
            show: false
        }
    }, {
        // 辅助 x 轴
        show: false,
        data: xAxisData.map(function(x){
            if(x == "5月11日")return " ";
            return x;
        })
    }],
    yAxis: {
        max: 1000,
        axisLine: {
            show: false
        }
    },
    series: [
        {
                // 辅助系列
                type           : 'bar',
                silent         : true,
                xAxisIndex     : 1,
                itemStyle      : {
                normal         : {
                barBorderRadius: 20,
                color          : '#ddd'
                    }
                },
                barWidth: 20,
                data: data.map(function (val) {
                    return 1000;
                })
            },
        {
            type: 'bar',
            data: data,
            barWidth: 20,
            itemStyle: {
                normal: {
                    barBorderRadius: 20,
                    color: new echarts.graphic.LinearGradient(0, 0, 0, 1, [{
                        offset: 0,
                        color: '#99d9ea'
                    }, {
                        offset: 1,
                        color: '#3fa7dc'
                    }]),
                    shadowColor: 'rgba(0, 0, 0, 0.4)',
                    shadowBlur: 20
                }
            }
        }
    ]
};