引用:http://www.oschina.net/code/snippet_197014_12286
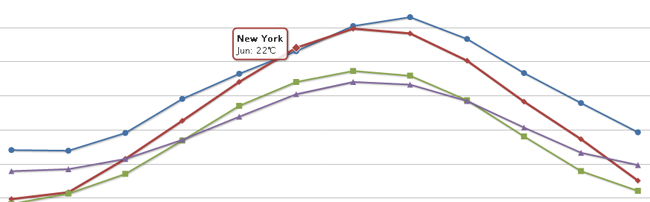
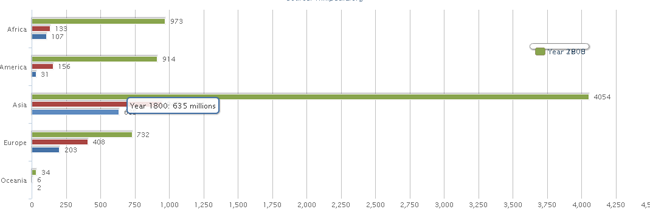
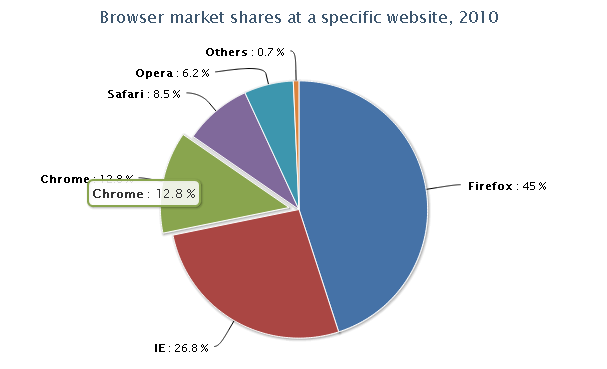
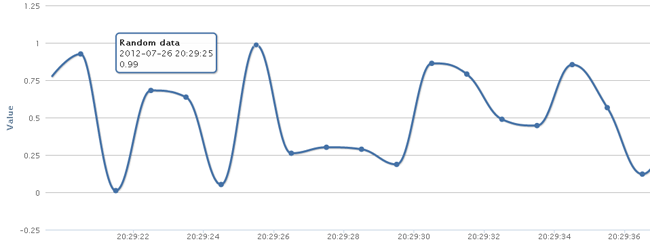
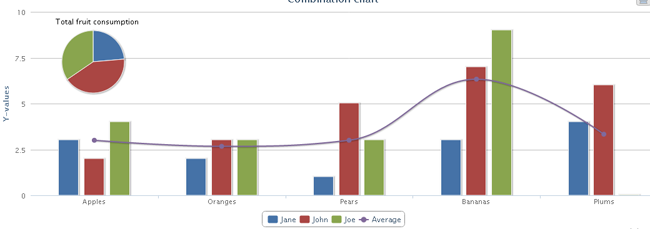
Jquery实现数据图表数据统计插件统计功能包括了时间序列,可缩放的、时间数据不规则间隔、面积百分比、堆叠和分组列、散射与回归线、花键与倒轴、地区失踪点、柱旋转标签。。。
效果如下:
标签: jQuery
代码片段(1)
[代码] [JavaScript]代码
01 |
<script type="text/javascript"> |
02 |
$(function () { |
03 |
var chart; |
04 |
$(document).ready(function() { |
05 |
chart = new Highcharts.Chart({ |
06 |
chart: { |
07 |
renderTo: 'container', |
08 |
type: 'area' |
09 |
}, |
10 |
title: { |
11 |
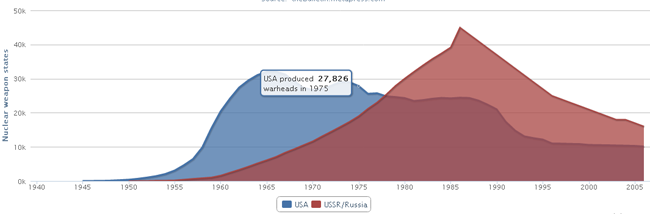
text: 'US and USSR nuclear stockpiles' |
12 |
}, |
13 |
subtitle: { |
14 |
text: 'Source: <a href="http://thebulletin.metapress.com/content/c4120650912x74k7/fulltext.pdf">'+ |
15 |
'thebulletin.metapress.com</a>' |
16 |
}, |
17 |
xAxis: { |
18 |
labels: { |
19 |
formatter: function() { |
20 |
return this.value; // clean, unformatted number for year |
21 |
} |
22 |
} |
23 |
}, |
24 |
yAxis: { |
25 |
title: { |
26 |
text: 'Nuclear weapon states' |
27 |
}, |
28 |
labels: { |
29 |
formatter: function() { |
30 |
return this.value / 1000 +'k'; |
31 |
} |
32 |
} |
33 |
}, |
34 |
tooltip: { |
35 |
formatter: function() { |
36 |
return this.series.name +' produced <b>'+ |
37 |
Highcharts.numberFormat(this.y, 0) +'</b><br/>warheads in '+ this.x; |
38 |
} |
39 |
}, |
40 |
plotOptions: { |
41 |
area: { |
42 |
pointStart: 1940, |
43 |
marker: { |
44 |
enabled: false, |
45 |
symbol: 'circle', |
46 |
radius: 2, |
47 |
states: { |
48 |
hover: { |
49 |
enabled: true |
50 |
} |
51 |
} |
52 |
} |
53 |
} |
54 |
}, |
55 |
series: [{ |
56 |
name: 'USA', |
57 |
data: [null, null, null, null, null, 6 , 11, 32, 110, 235, 369, 640, |
58 |
1005, 1436, 2063, 3057, 4618, 6444, 9822, 15468, 20434, 24126, |
59 |
27387, 29459, 31056, 31982, 32040, 31233, 29224, 27342, 26662, |
60 |
26956, 27912, 28999, 28965, 27826, 25579, 25722, 24826, 24605, |
61 |
24304, 23464, 23708, 24099, 24357, 24237, 24401, 24344, 23586, |
62 |
22380, 21004, 17287, 14747, 13076, 12555, 12144, 11009, 10950, |
63 |
10871, 10824, 10577, 10527, 10475, 10421, 10358, 10295, 10104 ] |
64 |
}, { |
65 |
name: 'USSR/Russia', |
66 |
data: [null, null, null, null, null, null, null , null ,null ,null, |
67 |
5, 25, 50, 120, 150, 200, 426, 660, 869, 1060, 1605, 2471, 3322, |
68 |
4238, 5221, 6129, 7089, 8339, 9399, 10538, 11643, 13092, 14478, |
69 |
15915, 17385, 19055, 21205, 23044, 25393, 27935, 30062, 32049, |
70 |
33952, 35804, 37431, 39197, 45000, 43000, 41000, 39000, 37000, |
71 |
35000, 33000, 31000, 29000, 27000, 25000, 24000, 23000, 22000, |
72 |
21000, 20000, 19000, 18000, 18000, 17000, 16000] |
73 |
}] |
74 |
}); |
75 |
}); |
76 |
|
77 |
}); |
78 |
</script> |