zoukankan      html  css  js  c++  java
  • 在线考试系统数据统计模块

    今日完成任务

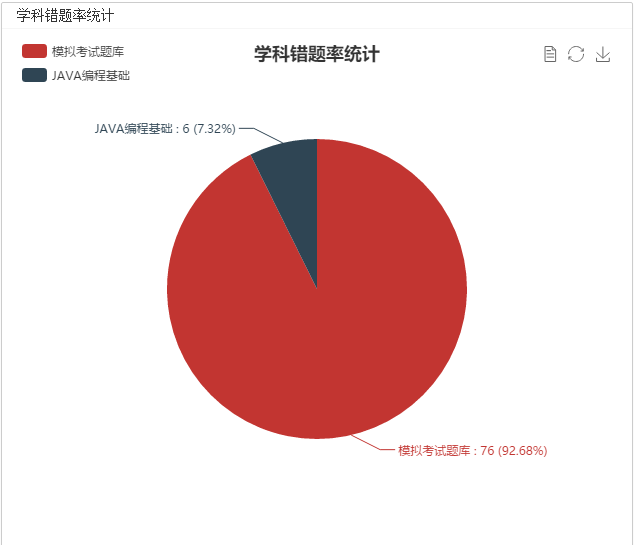
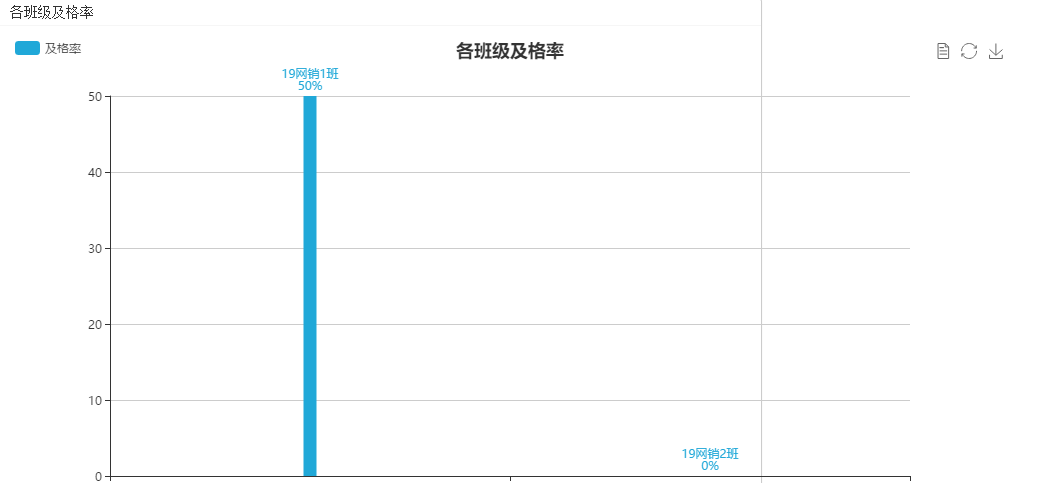
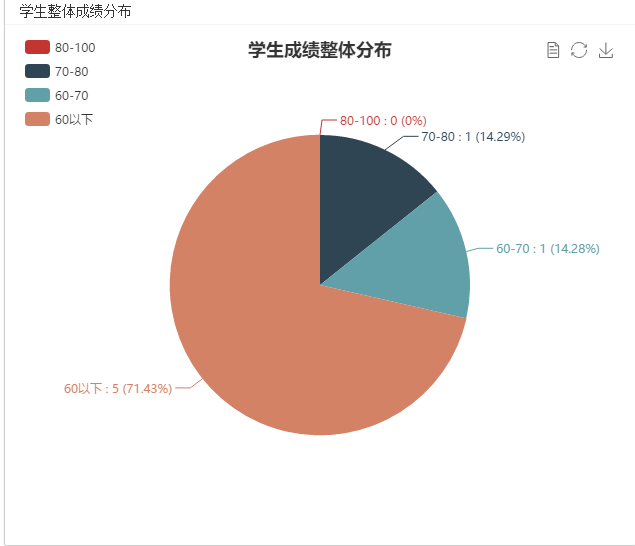
      今日完成了数据中心的部分功能。学习了百度了图表插件echarts ;

      1.学生的整体成绩分布

      2.学科错题率统计

      3.各班级的几个率

    系统截图


    核心源码

     $.ajax({
        url:'/data_list',
        type:'POST',
        dataType:'text',
        data:{'year':0},
        headers: {
            'X-CSRF-TOKEN': $('meta[name="_token"]').attr('content'),
        },
        success:function (msg) {
            var obj = JSON.parse(msg);
            var optionchartBing2 = {
                title: {
                    text: '学科错题率统计',
                    subtext: '', //副标题
                    x: 'center' //标题居中
                },
                tooltip: {
                    // trigger: 'item' //悬浮显示对比
                },
                legend: {
                    orient: 'vertical', //类型垂直,默认水平
                    left: 'left', //类型区分在左 默认居中
                    data: obj.bt
                },
                toolbox: {
                    show : true,
                    feature : {
                        mark : {show: true},
                        dataView : {show: true, readOnly: false},
                        restore : {show: true},
                        saveAsImage : {show: true}
                    }
                },
                series: [{
                    type: 'pie', //饼状
                    radius: '60%', //圆的大小
                    center: ['50%', '50%'], //居中
                    data: obj.jg,
                    itemStyle: {
                        emphasis: {
                            shadowBlur: 10,
                            shadowOffsetX: 0,
                            shadowColor: 'rgba(0, 0, 0, 0.5)'
                        },
                        normal:{
                            label:{
                                show: true,
                                formatter: '{b} : {c} ({d}%)'
                            },
                            labelLine :{show:true}
                        }
                    }
                }]
            };
            var chartBing = echarts.init(document.getElementById('Echartbing'));
            chartBing.setOption(optionchartBing2, true);

            var myChart = echarts.init(document.getElementById('Echartzhuclass'));
            option = {
                title : {
                    text : "各班级及格率",
                    x: 'center' //标题居中
                },
                tooltip : {
                    trigger: 'axis',
                    formatter:'{c}%'
                },
                legend: {
                    data:['及格率'],
                    x:'left'
                },
                toolbox: {
                    show : true,
                    feature : {
                        mark : {show: true},
                        dataView : {show: true, readOnly: false},
                        restore : {show: true},
                        saveAsImage : {show: true}
                    }
                },
                calculable : true,
                xAxis : [
                    {
                        type : 'category',
                        data : obj.class_name
                    }
                ],
                yAxis : [
                    {
                        type : 'value',
                        axisLabel : {
                            formatter: '{value}'
                        }
                    }
                ],
                series : [
                    {
                        name:'及格率',
                        type:'bar',
                        color:'#20a8d8',
                        barGap: '10%',
                        barWidth : 13,
                        barCategoryGap : '25%',
                        label:{
                            show: true,
                            position: 'top',
                            formatter: '{b}\n{c}%'
                        },
                        data:obj.jege_data
                    }
                ]
            };
            // 使用刚指定的配置项和数据显示图表。
            myChart.setOption(option);
        }
    });

    遇到问题

    遇到的问题。本身的layui是继承了echarts模块的,但是我的莫名其妙不能用,后来没有好的办法,只好单独下载了一个包。
    开始用起来不是很熟练,看文档就可以及基本解决问题

    解决问题

    
    参考文档 看demo代码基本可以使用这个插件

    项目的燃尽图


  • 相关阅读:
    使用cmd命令行窗口操作SqlServer
    .net core compatibility windows & windows compatible Linux
    Microsoft Azure Tutorial: Build your first movie inventory web app with just a few lines of code
    Running ASP.NET Core applications on Windows Subsystem for Linux
    Simple Use IEnumerable<T>
    JSON in SQL Server 2016
    [开源 .NET 跨平台 Crawler 数据采集 爬虫框架: DotnetSpider] [一] 初衷与架构设计
    NotBacon
    Create an Azure SQL database in the Azure portal
    Cisco IP 电话 将它的voice mail 发送到手机
  • 原文地址:https://www.cnblogs.com/sofic/p/13455679.html
Copyright © 2011-2022 走看看