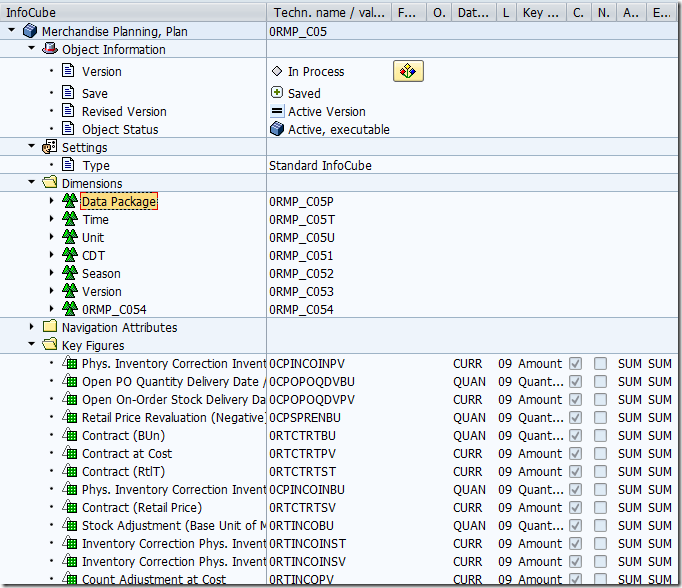
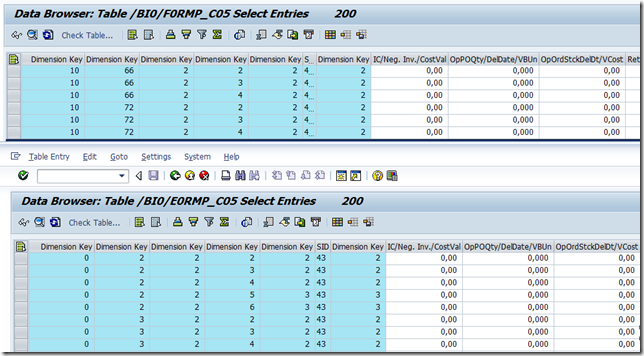
以infoCube 0RMP_C05 为例:
有7个dimension和多个key figures.
如何连接这些char的值,得知key figure的值?
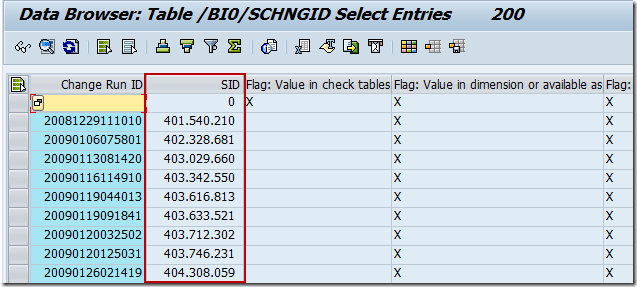
1. 首先知道了我的characteristic的值。每个dimension有好几个characteristics。根据charactersitics的值,我们到/BI0/S****表里面去找SID (e.g. /BI0/SCHNGID)。比如要知道具体时间,具体单位,具体article的买的情况。我们找到这些dimension对应的characteristic和他们的SID。
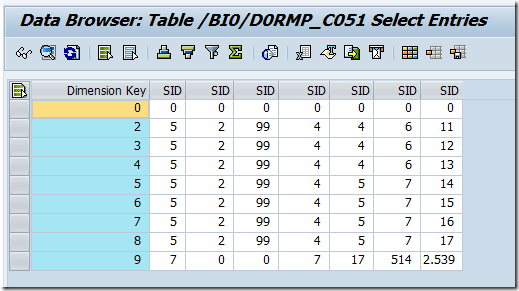
2. 我们通过这些SID找到了每个dimension的key。每个dimension有一个对应的表 /BI0/Dxxxxx (xxxxx为对应dimension的名字)。 由这张表可以看出不同char的组合对应的dimension key。
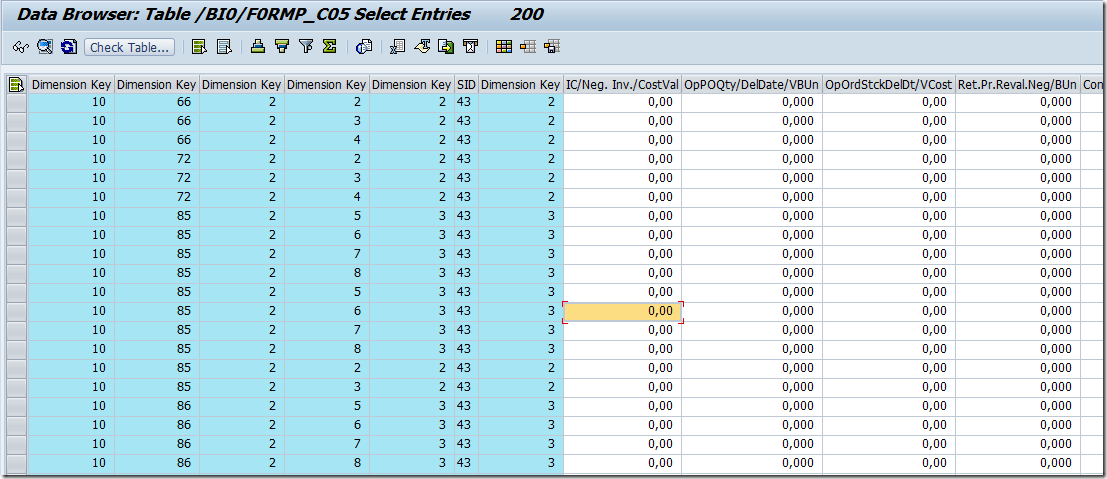
3. 根据各个dimension的key我们找到key figures。 得到了各个dimension的dimension key之后,就可以map到E表或F表,得到对应key figure的值了。
Key figures是一个个Info Object。可以右键Display显示具体信息。
=================================================================
Q: E表和F表的区别是什么?
Q: MAP中comparable store是什么意思?
Q:MAP中的Time Hierarchy的创建有什么用? (T-code: UPARP_HIER_T)
=================================================================
Aggregation Level
Use
Aggregation levels are used as InfoProviders for planning: with an aggregation level, you model levels whose data can be changed manually using input-ready queries or automatically using planning functions.
An aggregation level is set using a set of characteristics and key figures from the underlying InfoProvider. The key figures included in the aggregation level are aggregated using the characteristics that are not included in the aggregation level. ???
其实是,如果某char不在aggregation level中,那么planning就不care那个char。比如商品,分类,时间是char,销售额是key figure,如果商品不在aggregation level中,则计划只是到分类等的粒度。 在对应表中,记录对应的商品的SID是'#'。
In the simplest case, an aggregation level is located on a real-time enabled InfoCube.
The following conditions apply to both types of aggregation level:
● At least one key figure and one characteristic have to be included in the aggregation level.
● The key figures used have to have the database aggregations SUM, MIN or MAX. With MIN or MAX, key figure values can only be displayed. They cannot be changed using manual planning or planning functions.
● For key figures of type date or time, only the data type ‘DEC’ is supported.
● Referencing key figures (and thus also non-cumulative key figures or elimination of internal business volume) are not supported in aggregation layers.
● If a characteristic is compounded and used in an aggregation level, the aggregation level must also contain all compounding "parent" characteristics.
● If a key figure is used in an aggregation level and does not have a fixed unit of measure or currency, the aggregation level must contain the associated characteristic for the unit.
● If a key figure with exception aggregation is used in an aggregation level, the aggregation level must also contain the characteristic for exception aggregation if it occurs in the underlying InfoProvider.
● The aggregation level inherits a navigation attribute from the underlying InfoProvider if it includes the basic characteristic of the navigation attribute. Note that the navigation attribute for an aggregation level is not visible in the Planning Modeler. It is only visible in the Query Designer.
● An aggregation level cannot be created on MultiProviders if a characteristic of an InfoProvider contained in the MultiProvider supplies two different characteristics in the MultiProvider.
● If a characteristic on the InfoProvider that serves as the basis for an aggregation level is constant, this characteristic has to be included in the aggregation level.
===================================
Report:
SAP_INFOCUBE_DESIGNS
=====================================
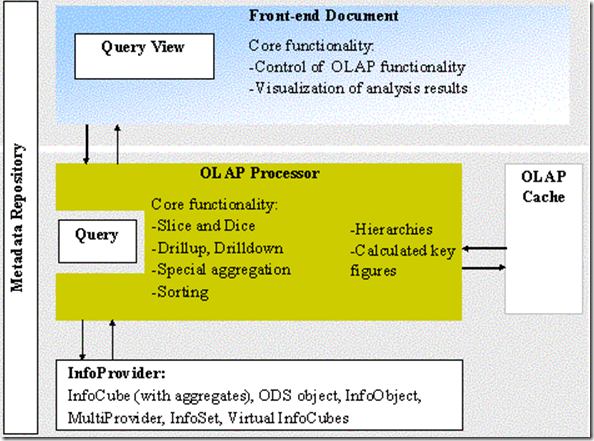
Transaction RSRT or RSRT2 is the central utility for the troubleshooting in OLAP processor, in particular the Olap path, which you can reach via "?" (help texts). This session provides an overview on this OLAP path.
Note 509038 - Troubleshooting in BEX/OLAP
Note 1475193 - Warnings in transaction RSRT -> Technical Info
Note 1151957 - Interesting facts about the OLAP Processor/Analytic Engine
- 在RSRT中的Technical information里面,点击Display Generated Report。这个report就是针对这个query模拟产生出来的。可以用于debug和abap具体分析。
- RSRT中的Query Definition Designer是BEX Quesry designer和OLAP processor 之间的interface。点击进入是debugger界面。
Overview of the Tables:
- VAR Contains all of the variables
- FST_F Contains the formulas for formula elements
- FST_K Contains the formulas for calculated key figures
- FORM Contains the free characteristics for all of the filter conditions and structures with their elements and exception cells.
RSRV
…
OLAP – in OLAP processor:
- Variables
- Tables
- Deep fields
http://help.sap.com/saphelp_sm32/helpdata/en/7c/c3e60666cd9147bb6242dc6500cd77/frameset.htm
http://help.sap.com/saphelp_nw70/helpdata/en/41/b987eb1443534ba78a793f4beed9d5/frameset.htm
========================================
BI OLAP Statistics:
Tables:
- RSDDSTAT_OLAP --- 其中event ID = 3200的,它的event次数就是传回前段的number of cells。
Note 1091304 - BEx Web Applications Java: Analysis of queries
---------------------------
OLAP Cache monitor:
- T-code: RSRCACHE

