大佬请自觉路过~ ~ ~
1、背景介绍
本文以我的博客站点其中一段时间的访问日志为例进行分析
-
用到的知识点
基本数据类型列表,基本数据类型字典,re模块正则匹配,pandas模块数据处理,xlwt模块excel写入等 -
最终实现的功能
分析得到日志中访问ip的top20,访问地址的top20,访问客户端ua的排名,并且生成excel报表
2、思路演进
2.1、第一步读取日志
对nginx进行日志分析,首先拿到需要分析的nginx日志文件,日志文件的内容具有固定的定义方法,每一行的日志中每一个特殊的字段都代表着具体的含义,例如:
95.143.192.110 - - [15/Dec/2019:10:22:00 +0800] "GET /post/pou-xi-he-jie-jue-python-zhong-wang-luo-nian-bao-de-zheng-que-zi-shi/ HTTP/1.1" 304 0 "https://www.ssgeek.com/" "Mozilla/5.0 (Macintosh; Intel Mac OS X 10_15_1) AppleWebKit/537.36 (KHTML, like Gecko) Chrome/78.0.3904.108 Safari/537.36"
上面的日志内容的字段信息依次代表着:访问者来源ip、访问时间、http请求方法、请求地址、http状态码、本次请求的字节大小、refer信息、客户端ua标识
因此,首先提炼出一行内容,对这行内容进行分组统计并记录每个字段的具体信息,然后把对这一行的分析手段去对整个日志文件进行分析,为了匹配日志中的每个字段,需要用到re模块进行正则匹配,代码如下:
import re


obj = re.compile(r'(?P<ip>.*?)- - [(?P<time>.*?)] "(?P<request>.*?)" (?P<status>.*?) (?P<bytes>.*?) "(?P<referer>.*?)" "(?P<ua>.*?)"')

def load_log(path):
    with open(path, mode="r", encoding="utf-8") as f:
        for line in f:
            line = line.strip()
            parse(line)

def parse(line):
    # 解析单行nginx日志
    try:
        result = obj.match(line)
        print(result.group("ip"))
    except:
        pass


if __name__ == '__main__':
    load_log("nginx_access.log")
通过re模块依次分组匹配为:ip、time、request、status、bytes、referer、ua
上面的内容最终打印出来了所有的访问者来源ip
进一步加强,输出所有字段,直接打印print(result.groupdict())即可,输出结果是多个字典,如下所示:
{'ip': '46.229.168.150 ', 'time': '24/Dec/2019:13:21:39 +0800', 'request': 'GET /post/zabbix-web-qie-huan-wei-nginx-ji-https HTTP/1.1', 'status': '301', 'bytes': '178', 'referer': '-', 'ua': 'Mozilla/5.0 (compatible; SemrushBot/6~bl; +http://www.semrush.com/bot.html)'}
2.2、第二步解析日志
精准分析单行日志,并且加入一些格式化输出和过滤的手段
load_log()函数:
在load_log()函数中,为了避免有错误的日志(类似于“脏数据”),因此定义了两个空列表lst和error_lst用来记录匹配的结果,列表中的每一个元素表示匹配的一行日志,最后打印了总行数,匹配到的行数,不能匹配到的行数(错误日志行数)
parse()函数:
在parse()函数中,传入参数line,一次对每行中分组匹配到的每一个字段进行处理,处理完成后赋值到列表元素,其中客户端ua标识仅仅列出了一些常见的,如果想要匹配的更为精确,可以参考常用浏览器(PC/移动)user-agent参考对照表,把匹配规则写的更精确即可
import re
import datetime

obj = re.compile(
    r'(?P<ip>.*?)- - [(?P<time>.*?)] "(?P<request>.*?)" (?P<status>.*?) (?P<bytes>.*?) "(?P<referer>.*?)" "(?P<ua>.*?)"')


def load_log(path):
    lst = []
    error_lst = []
    i = 0
    with open(path, mode="r", encoding="utf-8") as f:
        for line in f:
            line = line.strip()
            dic = parse(line)
            if dic:  # 正确的数据添加到lst列表中
                lst.append(dic)
            else:
                error_lst.append(line)  # 脏数据添加到error_lst列表中
            i += 1
    print(i)
    print(len(error_lst))
    print(len(lst))

def parse(line):
    # 解析单行nginx日志
    dic = {}
    try:
        result = obj.match(line)
        # ip处理
        ip = result.group("ip")
        if ip.strip() == '-' or ip.strip() == "":  # 如果是匹配到没有ip就把这条数据丢弃
            return False
        dic['ip'] = ip.split(",")[0]  # 如果有两个ip,取第一个ip

        # 状态码处理
        status = result.group("status")  # 状态码
        dic['status'] = status

        # 时间处理
        time = result.group("time")  # 21/Dec/2019:21:45:31 +0800
        time = time.replace(" +0800", "")  # 替换+0800为空
        t = datetime.datetime.strptime(time, "%d/%b/%Y:%H:%M:%S")  # 将时间格式化成友好的格式
        dic['time'] = t

        # request处理
        request = result.group(
            "request")  # GET /post/pou-xi-he-jie-jue-python-zhong-wang-luo-nian-bao-de-zheng-que-zi-shi/ HTTP/1.1
        a = request.split()[1].split("?")[0]  # 往往url后面会有一些参数,url和参数之间用?分隔,取出不带参数的url
        dic['request'] = a

        # user_agent处理
        ua = result.group("ua")
        if "Windows NT" in ua:
            u = "windows"
        elif "iPad" in ua:
            u = "ipad"
        elif "Android" in ua:
            u = "android"
        elif "Macintosh" in ua:
            u = "mac"
        elif "iPhone" in ua:
            u = "iphone"
        else:
            u = "其他设备"
        dic['ua'] = u

        # refer处理
        referer = result.group("referer")
        dic['referer'] = referer

        return dic

    except:
        return False


if __name__ == '__main__':
    load_log("nginx_access.log")
执行代码,查看打印的结果,控制台输出:
9692
542
9150
依次表示日志文件中的总行数、匹配错误(没有匹配到的)的行数、匹配正确的行数
2.3、第三步分析日志
利用pandas模块进行日志的分析
analyse()函数:
将解析过滤得到的lst列表作为参数传入,列表中的数据格式形如[{ip:xxx, api:xxx, status:xxxx, ua:xxx}]
df = pd.DataFrame(lst)将解析得到的列表转换成为类似表格的类型,控制台的输出df如下,处理后为每个数据加上了序号,第一行相当于表头,表头就是前面得到的字典中的key
                    ip status  ...       ua                  referer
0      95.143.192.110     200  ...      mac                        -
1      95.143.192.110     304  ...      mac                        -
2      95.143.192.110     304  ...      mac                        -
3      95.143.192.110     304  ...      mac  https://www.ssgeek.com/
4      203.208.60.122     200  ...  android                        -
...                ...    ...  ...      ...                      ...
9145      46.4.60.249     404  ...     其他设备                        -
9146      46.4.60.249     404  ...     其他设备                        -
9147      46.4.60.249     404  ...     其他设备                        -
9148      46.4.60.249     404  ...     其他设备                        -
9149  154.223.188.124     404  ...  windows                        -
pd.value_counts(df['ip'])取出ip并统计数ip的次数;得到的结果第一列是ip,第二列是次数,pandas默认将第一列认为是行索引,因此需要将数据整体右移,通过reset_index()重新定义一个索引即可,效果形如:
                 index   ip
0      89.163.242.228   316
1     207.180.220.114   312
2         78.46.90.53   302
3        144.76.38.10   301
4        78.46.61.245   301
...                ...  ...
1080    203.208.60.85     1
1081      66.249.72.8     1
1082     141.8.132.13     1
1083    207.46.13.119     1
1084     203.208.60.7     1
这个时候发现索引有了,但是表头也跟着右移了,不对应了,需要重新设置一个表头reset_index().rename(columns={"index": "ip", "ip": "count"}),效果形如
                    ip  count
0      89.163.242.228     316
1     207.180.220.114     312
2         78.46.90.53     302
3        78.46.61.245     301
4        144.76.38.10     301
...                ...    ...
1080     47.103.17.71       1
1081    42.156.254.92       1
1082  220.243.136.156       1
1083   180.163.220.61       1
1084   106.14.215.243       1
往往分析日志只需要得到访问次数的前几名,例如前20名,pandas同样给出了很方便的iloc通过切片实现这个需求,iloc[:20, :]:取出前20行,取出所有列,最终的处理代码为
    ip_count = pd.value_counts(df['ip']).reset_index().rename(columns={"index": "ip", "ip": "count"}).iloc[:20, :]
    print(ip_count)
得到的数据结果为
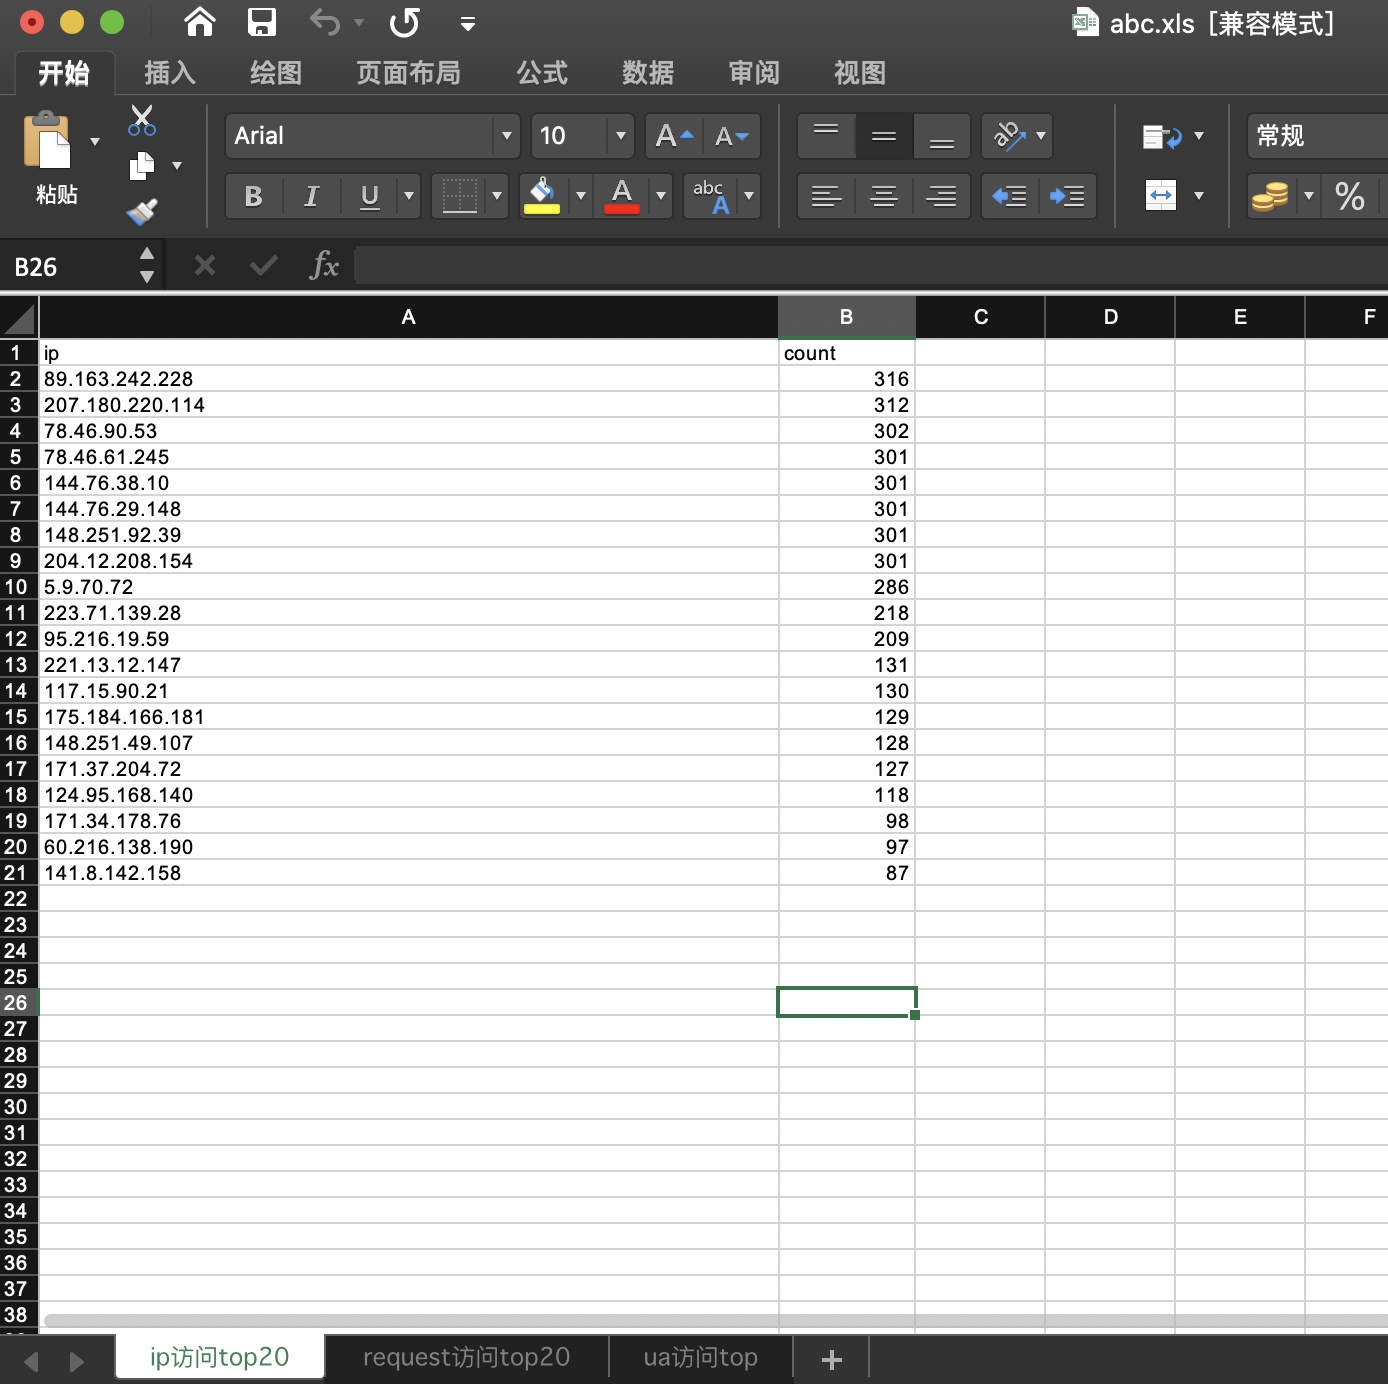
                  ip  count
0    89.163.242.228     316
1   207.180.220.114     312
2       78.46.90.53     302
3      144.76.38.10     301
4      78.46.61.245     301
5     144.76.29.148     301
6    204.12.208.154     301
7     148.251.92.39     301
8         5.9.70.72     286
9     223.71.139.28     218
10     95.216.19.59     209
11    221.13.12.147     131
12     117.15.90.21     130
13  175.184.166.181     129
14   148.251.49.107     128
15    171.37.204.72     127
16   124.95.168.140     118
17    171.34.178.76      98
18   60.216.138.190      97
19    141.8.142.158      87
同样,可以把request、ua等进行相同的操作
2.4、第四步生成报告
利用xlwt模块将pandas分析得到的数据写入到excel表格中,写入前需要将pandas处理后的数据转化成普通的数据
    ip_count_values = ip_count.values
    request_count_values = request_count.values
    ua_count_values = ua_count.values
这个数据类型是:数组对象numpy.ndarray,形如:
[['89.163.242.228 ' 316]
 ['207.180.220.114 ' 312]
 ['78.46.90.53 ' 302]
 ['204.12.208.154 ' 301]
 ['144.76.29.148 ' 301]
 ['144.76.38.10 ' 301]
 ['78.46.61.245 ' 301]
 ['148.251.92.39 ' 301]
 ['5.9.70.72 ' 286]
 ['223.71.139.28 ' 218]
 ['95.216.19.59 ' 209]
 ['221.13.12.147 ' 131]
 ['117.15.90.21 ' 130]
 ['175.184.166.181 ' 129]
 ['148.251.49.107 ' 128]
 ['171.37.204.72 ' 127]
 ['124.95.168.140 ' 118]
 ['171.34.178.76 ' 98]
 ['60.216.138.190 ' 97]
 ['141.8.142.158 ' 87]]
通过xlwt模块写入sheet页,每个sheet页中写入对应处理的数据
# 写入excel
wb = xlwt.Workbook()  # 打开一个excel文档
sheet = wb.add_sheet("ip访问top20")  # 新建一个sheet页
# 写入头信息
row = 0
sheet.write(row, 0, "ip")  # 写入行,列,内容
sheet.write(row, 1, "count")  # 写入行,列,内容
row += 1  # 行号加一
for item in ip_count_values:
    sheet.write(row, 0, item[0])
    sheet.write(row, 1, item[1])
    row += 1
2.5、第五步日志采集
日志分析完了,回过头来需要的是采集到日志文件,并且定时的去进行分析,可以利用time模块得到时间并且判断,实现定时的分析,例如,每月3号的凌晨1点进行日志分析
import time

if __name__ == '__main__':
    while 1:
        stime = datetime.datetime.now().strftime("%d:%H:%M:%S")
        if stime == "03:01:00:00":
            lst, error_lst = load_log("nginx_access.log")
            analyse(lst)
        time.sleep(1)
当然也可以通过服务器级别的定时任务功能定时的调用脚本分析
2.6、结果展示
按照前面的演进过程,最终的代码如下:
import re
import datetime
import pandas as pd
import xlwt

obj = re.compile(
    r'(?P<ip>.*?)- - [(?P<time>.*?)] "(?P<request>.*?)" (?P<status>.*?) (?P<bytes>.*?) "(?P<referer>.*?)" "(?P<ua>.*?)"')


def load_log(path):
    lst = []
    error_lst = []
    i = 0
    with open(path, mode="r", encoding="utf-8") as f:
        for line in f:
            line = line.strip()
            dic = parse(line)
            if dic:  # 正确的数据添加到lst列表中
                lst.append(dic)
            else:
                error_lst.append(line)  # 脏数据添加到error_lst列表中
            i += 1

    return lst, error_lst

def parse(line):
    # 解析单行nginx日志
    dic = {}
    try:
        result = obj.match(line)
        # ip处理
        ip = result.group("ip")
        if ip.strip() == '-' or ip.strip() == "":  # 如果是匹配到没有ip就把这条数据丢弃
            return False
        dic['ip'] = ip.split(",")[0]  # 如果有两个ip,取第一个ip

        # 状态码处理
        status = result.group("status")  # 状态码
        dic['status'] = status

        # 时间处理
        time = result.group("time")  # 21/Dec/2019:21:45:31 +0800
        time = time.replace(" +0800", "")  # 替换+0800为空
        t = datetime.datetime.strptime(time, "%d/%b/%Y:%H:%M:%S")  # 将时间格式化成友好的格式
        dic['time'] = t

        # request处理
        request = result.group(
            "request")  # GET /post/pou-xi-he-jie-jue-python-zhong-wang-luo-nian-bao-de-zheng-que-zi-shi/ HTTP/1.1
        a = request.split()[1].split("?")[0]  # 往往url后面会有一些参数,url和参数之间用?分隔,取出不带参数的url
        dic['request'] = a

        # user_agent处理
        ua = result.group("ua")
        if "Windows NT" in ua:
            u = "windows"
        elif "iPad" in ua:
            u = "ipad"
        elif "Android" in ua:
            u = "android"
        elif "Macintosh" in ua:
            u = "mac"
        elif "iPhone" in ua:
            u = "iphone"
        else:
            u = "其他设备"
        dic['ua'] = u

        # refer处理
        referer = result.group("referer")
        dic['referer'] = referer

        return dic

    except:
        return False


def analyse(lst): # [{ip:xxx, api:xxx, status:xxxx, ua:xxx}]
    df = pd.DataFrame(lst)  # 转换成表格
    # print(df)
    # print(df['ip'])  # 只取出ip这一列
    ip_count = pd.value_counts(df['ip']).reset_index().rename(columns={"index": "ip", "ip": "count"}).iloc[:20, :]
    request_count = pd.value_counts(df['request']).reset_index().rename(columns={"index": "request", "request": "count"}).iloc[:20, :]
    ua_count = pd.value_counts(df['ua']).reset_index().rename(columns={"index": "ua", "ua": "count"}).iloc[:, :]

    # 从pandas转化成我们普通的数据
    ip_count_values = ip_count.values
    request_count_values = request_count.values
    ua_count_values = ua_count.values
    # print(type(ip_count_values))

    # 写入excel
    wb = xlwt.Workbook()  # 打开一个excel文档
    sheet = wb.add_sheet("ip访问top20")  # 新建一个sheet页
    # 写入头信息
    row = 0
    sheet.write(row, 0, "ip")  # 写入行,列,内容
    sheet.write(row, 1, "count")  # 写入行,列,内容
    row += 1  # 行号加一
    for item in ip_count_values:
        sheet.write(row, 0, item[0])
        sheet.write(row, 1, item[1])
        row += 1

    sheet = wb.add_sheet("request访问top20")  # 新建一个sheet页
    # 写入头信息
    row = 0
    sheet.write(row, 0, "request")  # 写入行,列,内容
    sheet.write(row, 1, "count")  # 写入行,列,内容
    row += 1  # 行号加一
    for item in request_count_values:
        sheet.write(row, 0, item[0])
        sheet.write(row, 1, item[1])
        row += 1

    sheet = wb.add_sheet("ua访问top")  # 新建一个sheet页
    # 写入头信息
    row = 0
    sheet.write(row, 0, "ua")  # 写入行,列,内容
    sheet.write(row, 1, "count")  # 写入行,列,内容
    row += 1  # 行号加一
    for item in ua_count_values:
        sheet.write(row, 0, item[0])
        sheet.write(row, 1, item[1])
        row += 1

    wb.save("abc.xls")

if __name__ == '__main__':
    lst, error_lst = load_log("nginx_access.log")
    analyse(lst)
生成的excel报表内容如下
-
ip排名
-
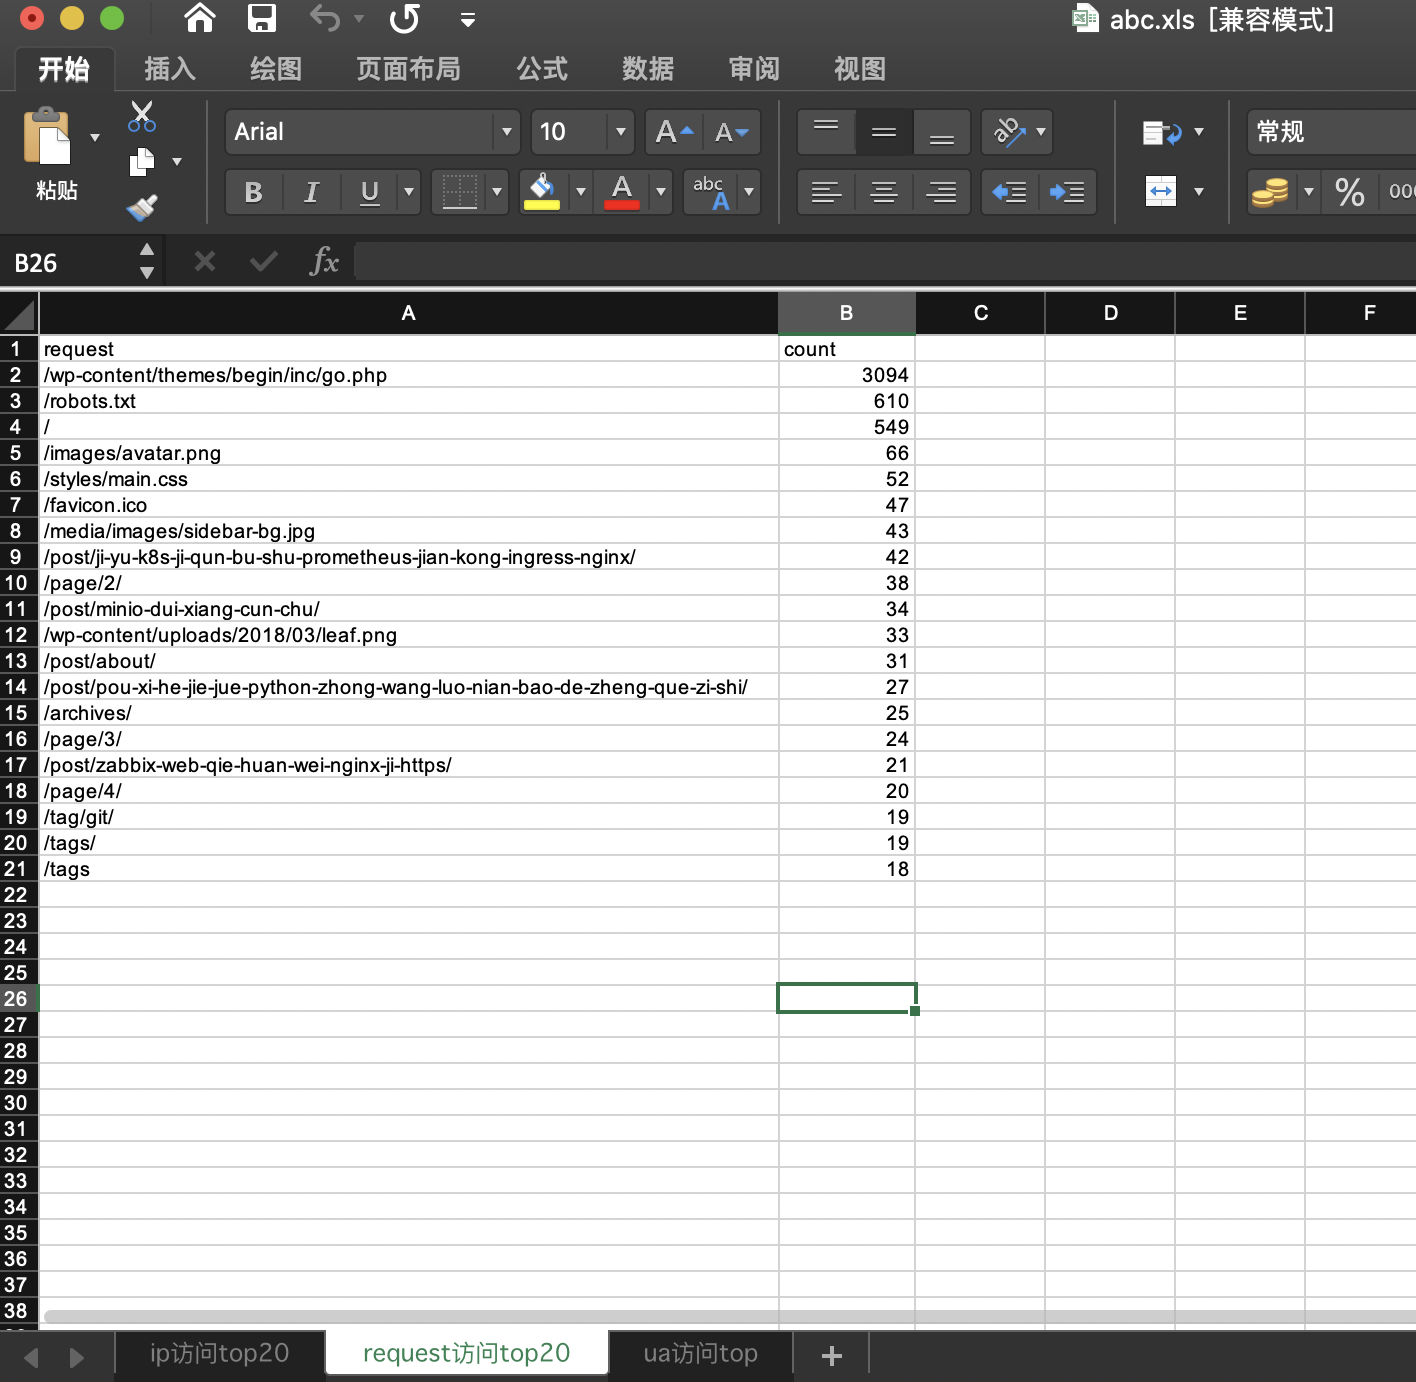
访问地址排名
-
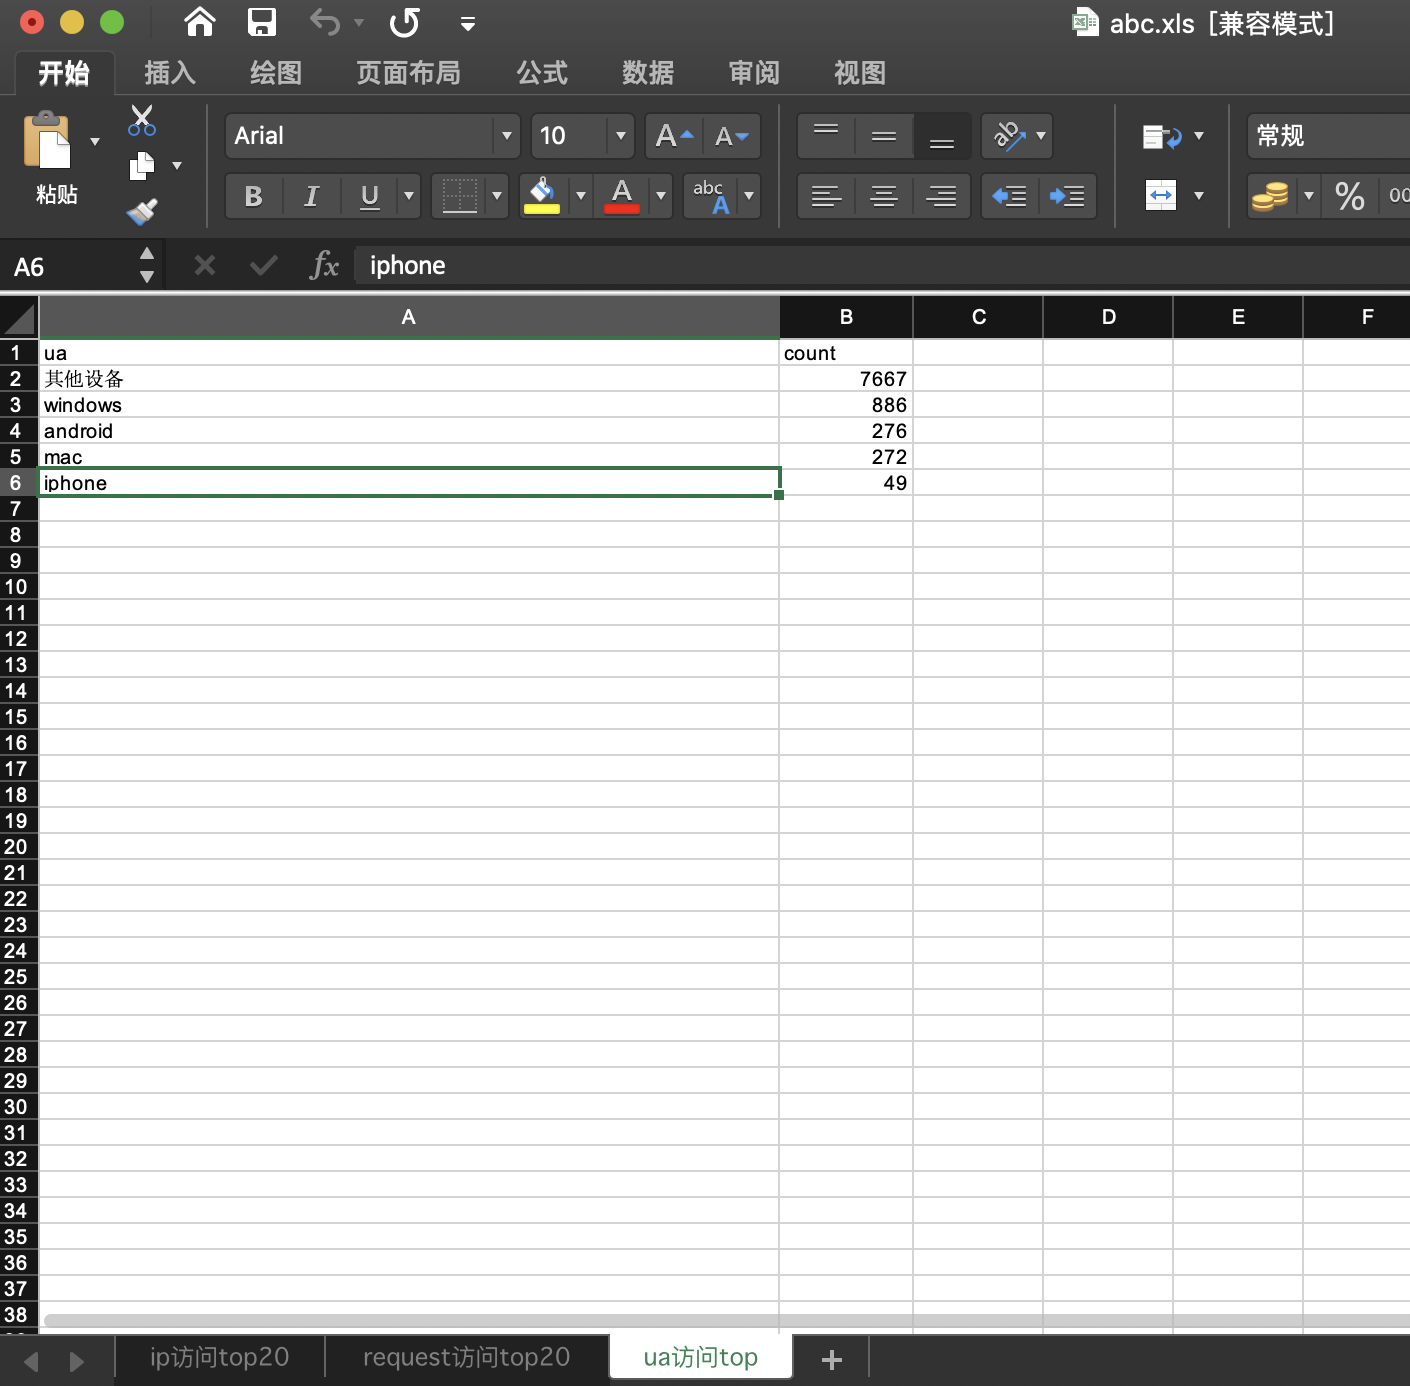
客户端
ua排名
2.7、可扩展方向
本文进行日志的分析算是入门之作,可以进一步扩展的方向比如:分析报表的定时消息邮件等推送,分析报表的图形化展示等等