主要是对配置的一些说明,项目githup地址https://github.com/shengbid/echarts-series
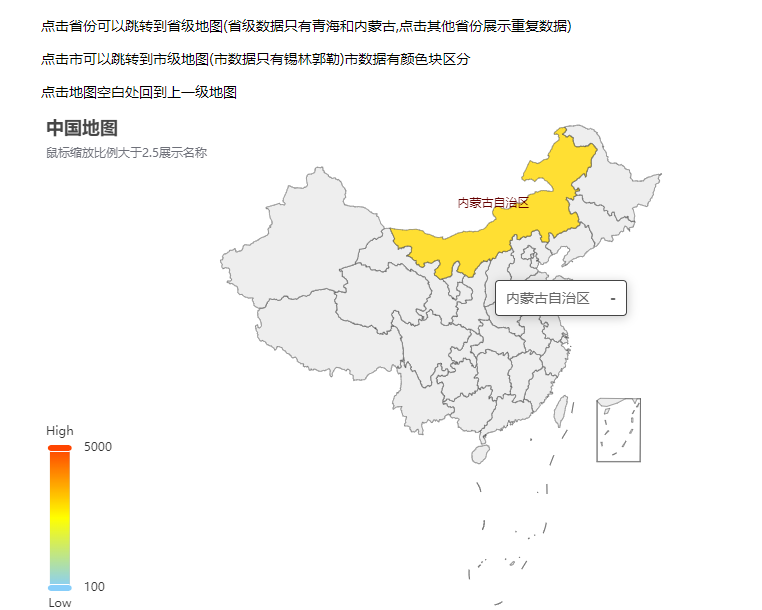
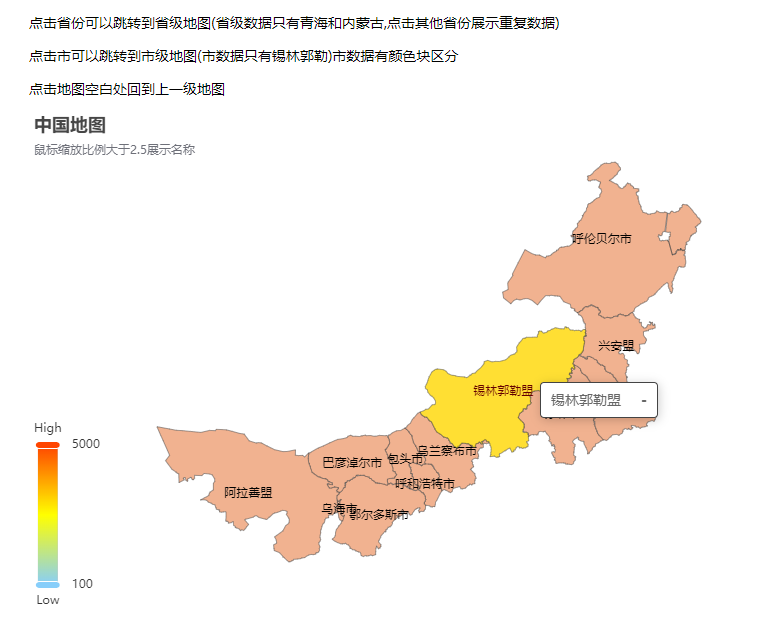
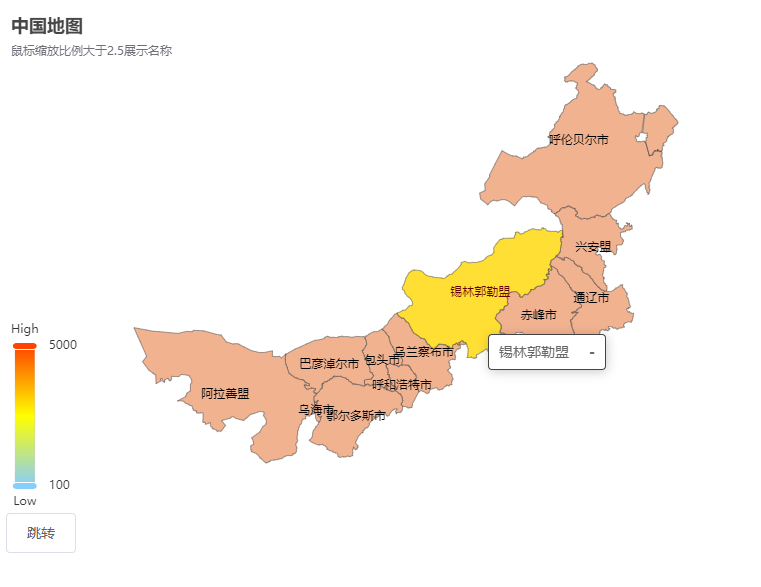
这个地图做了3个层级,第一层: 中国地图; 第二层: 省级地图,点击第一层进入; 第三层: 市级地图, 点击第二层进入
点击空白处可以回到上一层
效果图:
第一层 第二层
第三层
实现步骤,文末会有完整代码,可以根据步骤来实现,会更清晰
1.下载所需要的地图文件,需要符合echarts的数据规则.我是到这个网址下载的地图文件:http://datav.aliyun.com/tools/atlas/#&lat=30.316551722910077&lng=106.68898666525287&zoom=3.5
下载下来的json文件改一下文件名,默认是中文的
2.在项目中引入
import chinaJson from '@/utils/map/china.json' // json数据引入
import qinghai from '@/utils/map/qinghai.json'
import neimenggu from '@/utils/map/neimenggu.json'
import xilinguole from '@/utils/map/xilinguole.json'
3.在项目中提供一个展示DOM元素, 配置好echarts的基础option,注册地图
<template>
  <div class="line-container">
    <div>
      <div id="mapChart"></div>
    </div>
  </div>
</template>

<script>
export default {
  name: 'mapChart',
  data() {
    return {
      option: {
         title: {
          text: '中国地图',
          subtext: '鼠标缩放比例大于2.5展示名称'
         },
        tooltip: {
          trigger: 'item'
        },
      },
      mapChart: '', // 地图实例
      level: 1 // 当前层级
    }
  },
  created() {},
  mounted() {
    this.getMapChart()
  },

   methods: {
    // 初始化图表
    getMapChart() {
      this.mapChart = this.$echart.init(document.getElementById('mapChart'))

      this.$echart.registerMap('china', chinaJson)

      this.option.series = [{
                type: 'map',
                map: 'china',
                zoom: 1.2,
                roam: true
            }]
      this.mapChart.setOption(this.option)
    }
  }
}

</script>
4.上一步做完就能在页面上看到一个中国地图了,echarts默认如果你注册的地图名称是china,会展示右下角南海诸岛,如果不想展示,可以换一个名称
5.现在加入点击事件,直接加在第三步的getMapChart方法里
getMapChart() {
  .
  .
  .
  this.mapChart.setOption(this.option)

  // 省级地图
  const provinceName = {
    '青海省': qinghai, // 自己建立的地图数据映射
    '内蒙古自治区': neimenggu
  }
  // 市级地图
  const cityName = {
    '锡林郭勒盟': xilinguole
  }
  // 地图数据
  const map = {
    2: [{
          type: 'map',
          map: 'province', // 省级
          label: {
            show: true
          },
          itemStyle: {
              areaColor: '#f1b290',
          },
          zoom: 1,
          roam: true
      }],
    3: [{
          type: 'map',
          map: 'city', // 市级
          label: {
            show: true
          },
          zoom: 1,
          roam: true,
      }
    ]
  }

  // 点击地图
  this.mapChart.on('click', (params) => {
    console.log(params)
    let mapData = qinghai
    if (this.level === 1) { // 省级地图
      if (provinceName[params.name]) {
        mapData = provinceName[params.name]
      }
      this.level = 2
      this.$echart.registerMap('province', mapData)
    } else if (this.level === 2) { // 市级地图
      mapData = cityName['锡林郭勒盟']
      this.level = 3
      this.$echart.registerMap('city', mapData)
    }
    this.option.series = map[this.level] // 重置地图数据
    this.mapChart.setOption(this.option)
  })

}
6.上一步做完就能实现点击地图跳转到下一级功能了,现在在加上点击空白处跳转上一级的功能
echarts没有单独的点击空白处的事件,但是提供了getZr()方法,点击图表所有地方都可以触发事件,返回event,可以通过判断event.target来判断点击的是否是空白处
// 点击所有地方触发
  this.mapChart.getZr().on('click', (event) => {
    // 该监听器正在监听一个`zrender 事件`。
    // console.log(event.target, this.level)
    // 点击空白处回到上一级
    if (!event.target && this.level !== 1) {
      if (this.level === 2) { // 如果当前是在第二级,返回第一级
        this.option.series = [{
            type: 'map',
            map: 'china',
            label: {
              show: false
            },
            zoom: 1.2,
            roam: true
        }]
        this.level = 1
      } else if (this.level === 3) { // 如果当前是在第三级,返回第二级
        this.option.series = map[2]
        this.level = 2
      }

      this.mapChart.setOption(this.option)
    }
  })
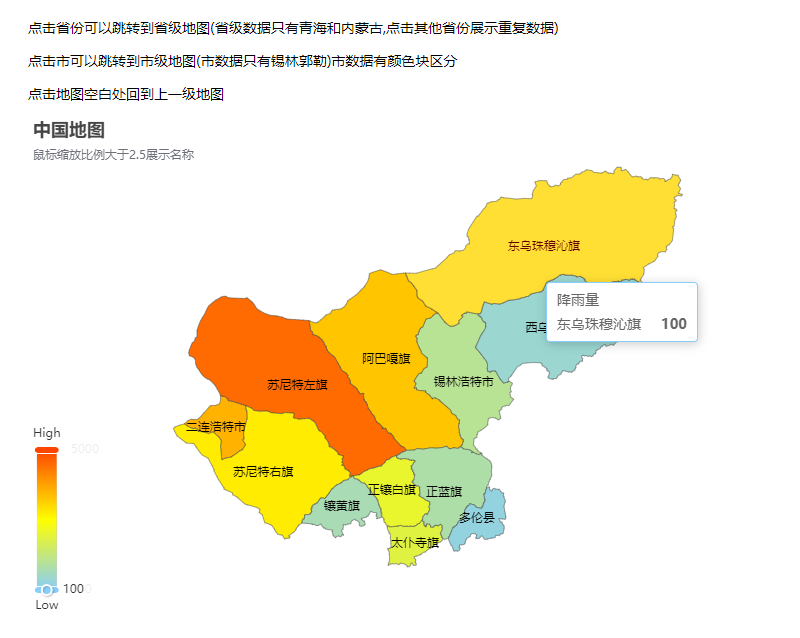
7.以上配置就可以实现一个地图的层级跳转了,默认的地图数据只有name值,如果你还需要展示其他额外数据可以设置data数据,但是要和地图里的name对应上
const visualData = [ // 锡林郭勒盟映射数据,可以自己增加额外属性
    {name: '东乌珠穆沁旗', value: 100, level: 3},
    {name: '西乌珠穆沁旗', value: 500, level: 3},
    {name: '锡林浩特市', value: 1100, level: 3},
    {name: '阿巴嘎旗', value: 3300, level: 3},
    {name: '正蓝旗', value: 900},
    {name: '多伦县', value: 350},
    {name: '正镶白旗', value: 2100},
    {name: '太仆寺旗', value: 1900},
    {name: '苏尼特左旗', value: 4500},
    {name: '苏尼特右旗', value: 2800},
    {name: '二连浩特市', value: 3560},
    {name: '镶黄旗', value: 789},
  ]

  const map = {
    2: [{
          type: 'map',
          map: 'province',
          label: {
            show: true
          },
          itemStyle: {
              areaColor: '#f1b290',
          },
          zoom: 1,
          roam: true
      }],
    3: [{
          type: 'map',
          map: 'city',
          name: '降雨量',
          label: {
            show: true
          },
          zoom: 1,
          roam: true,
          data: visualData // 设置数据
      }
    ]
  }
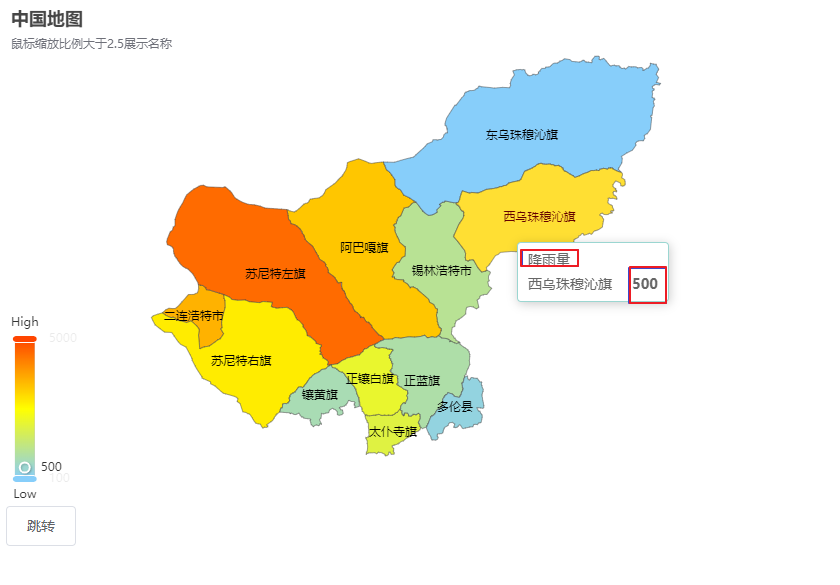
8.地图的区域颜色默认是灰色,你可以设置itemStyle改变颜色和边框,但是这个改变是整个地图一起改变.如果希望根据某个值,如value值大小进行颜色区分,可以添加visualMap,视觉映射
data() {
    return {
      option: {
         title: {
          text: '中国地图',
          subtext: '鼠标缩放比例大于2.5展示名称'
         },
        tooltip: {
          trigger: 'item'
        },
        visualMap: { // 设置视觉映射
            min: 100,
            max: 5000,
            text: ['High', 'Low'],
            realtime: false,
            calculable: true,
            inRange: {
                color: ['lightskyblue', 'yellow', 'orangered']
            }
        },
      },
      mapChart: '',
      level: 1
    }
  },
9.最后说一下,我的地图用的是series的type:'map',不是geo属性
这两个的区别:
geo是地理坐标系组件,可以理解为背景图
type:'map',地图, 主要用于地理区域数据的可视化
也就是如果你要展示的某个地区的数据可以用type:'map',因为你可以设置data来展示你需要展示的数据;如果你要做的是类似散点图,比如GDP全国前十,你要展示的是前十这几个数据,但是需要全国地图做背景就用geo
完整代码:
<template>
  <div class="line-container">
    <p>点击省份可以跳转到省级地图(省级数据只有青海和内蒙古,点击其他省份展示重复数据)</p>
    <p>点击市可以跳转到市级地图(市数据只有锡林郭勒)市数据有颜色块区分</p>
    <p>点击地图空白处回到上一级地图</p>
    <div>
      <div id="mapChart"></div>
    </div>
  </div>
</template>

<script>
import chinaJson from '@/utils/map/china.json' // json数据引入
import qinghai from '@/utils/map/qinghai.json'
import neimenggu from '@/utils/map/neimenggu.json'
import xilinguole from '@/utils/map/xilinguole.json'

export default {
  name: 'mapChart',
  data() {
    return {
      option: {
         title: {
          text: '中国地图',
          subtext: '鼠标缩放比例大于2.5展示名称'
         },
        tooltip: {
          trigger: 'item'
        },
        visualMap: {
            min: 100,
            max: 5000,
            text: ['High', 'Low'],
            realtime: false,
            calculable: true,
            inRange: {
                color: ['lightskyblue', 'yellow', 'orangered']
            }
        },
      },
      mapChart: '',
      level: 1
    }
  },
  created() {},
  mounted() {
    this.getMapChart()
  },
  methods: {
    // echarts初始化
    getMapChart() {
      this.mapChart = this.$echart.init(document.getElementById('mapChart'))

      this.$echart.registerMap('china', chinaJson);

      this.option.series = [{
                type: 'map',
                map: 'china',
                zoom: 1.2,
                roam: true
            }]
      this.mapChart.setOption(this.option)

      // 监听地图缩放事件
      this.mapChart.on('georoam', (params) => {
        // console.log(params)
        const moption = this.mapChart.getOption()
        console.log(moption)
        if (params.zoom) { // 缩放事件
          const zoom = moption.series[0].zoom
          this.option.series[0].zoom = zoom
          if (zoom > 2.5) {
            this.option.series[0].label = {
              show: true
            }
            this.mapChart.setOption(this.option)
          } else {
             this.option.series[0].label = {
              show: false
            }
            this.mapChart.setOption(this.option)
          }
        }
      })
      // geo设置可用
      // this.mapChart.on('geoselectchanged', (params) => {
      //   console.log(params)
      // })

      // 省级地图
      const provinceName = {
        '青海省': qinghai,
        '内蒙古自治区': neimenggu
      }
      // 市级地图
      const cityName = {
        '锡林郭勒盟': xilinguole
      }

      // 获取地图数据
      const map = this.getMap()

      // 点击地图省份
      this.mapChart.on('click', (params) => {
        console.log(params)
        let mapData = qinghai
        if (this.level === 1) {
          if (provinceName[params.name]) {
            mapData = provinceName[params.name]
          }
          this.level = 2
          this.$echart.registerMap('province', mapData)
        } else if (this.level === 2) {
          mapData = cityName['锡林郭勒盟']
          this.level = 3
          this.$echart.registerMap('city', mapData)
        }
        this.option.series = map[this.level]
        this.mapChart.setOption(this.option)
      })
      // 点击所有地方触发
      this.mapChart.getZr().on('click', (event) => {
          // 该监听器正在监听一个`zrender 事件`。
          // console.log(event.target, this.level)
          // 点击空白处回到上一级
          if (!event.target && this.level !== 1) {
            if (this.level === 2) {
              this.option.series = [{
                  type: 'map',
                  map: 'china',
                  label: {
                    show: false
                  },
                  zoom: 1.2,
                  roam: true
              }]
              this.level = 1
            } else if (this.level === 3) {
              this.option.series = map[2]
              this.level = 2
            }

            this.mapChart.setOption(this.option)
          }
      });
    },

    // 获取地图数据
    getMap () {
      const visualData = [ // 锡林郭勒盟映射数据,可以自己增加额外属性
        {name: '东乌珠穆沁旗', value: 100, level: 3},
        {name: '西乌珠穆沁旗', value: 500, level: 3},
        {name: '锡林浩特市', value: 1100, level: 3},
        {name: '阿巴嘎旗', value: 3300, level: 3},
        {name: '正蓝旗', value: 900},
        {name: '多伦县', value: 350},
        {name: '正镶白旗', value: 2100},
        {name: '太仆寺旗', value: 1900},
        {name: '苏尼特左旗', value: 4500},
        {name: '苏尼特右旗', value: 2800},
        {name: '二连浩特市', value: 3560},
        {name: '镶黄旗', value: 789},
      ]
      const map = {
        2: [{
              type: 'map',
              map: 'province',
              label: {
                show: true
              },
              itemStyle: {
                  areaColor: '#f1b290',
              },
              zoom: 1,
              roam: true
          }],
        3: [{
              type: 'map',
              map: 'city',
              name: '降雨量',
              label: {
                show: true
              },
              zoom: 1,
              roam: true,
              data: visualData // 设置视觉映射数据
          }
        ]
      }
      return map
    }
  }
}
</script>

<style>
#mapChart {
   800px;
  height: 500px;
}
</style>