Since there is not much user documentation related to Firebug features (and there is a lot what to know about) I have decided to put together several posts about existing features.
This post is intended as a detailed explanation of the Net panel from the user perspective. This post is not about developing an extension for this panel or Firebug itself. Also notice that all features described below are available (some of them introduced) in Firebug 1.4.
You'll be surprised how many features is there! ![]()
Net Panel Overview
The main purpose of the Net panel is to monitor HTTP traffic initiated by a web page and simply present all collected and computed information to the user. It's content is composed from list of entries where each entry represents one request/response round trip made by the page.
![]()
Click the image to get full size.
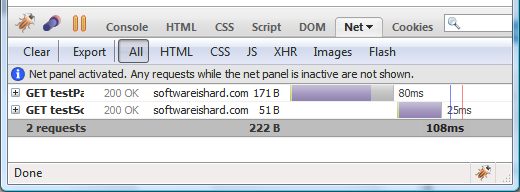
The image above shows the result from a page that sent two network requests to the server in order to load. The first request is for the top testPage1.htm document (the page itself) and the second for embedded testScript1.js script file.
If you have Firebug installed enable Net panel and click here to see the example live.
Each entry displays basic info about the request and a graphical Timeline that depicts load phases in time. For now it's enough to say that it took 80ms to load the page testPage.htm and after it was loaded the script file testScript.js started to load, which took another 25ms (see more info about the Timeline below).
Following info is displayed:
- HTTP request method (GET).
- Response status and description (200 OK).
- Requested file name (testPage1.htm) And if the mouse cursor moves over it, entire URL is displayed.
- Domain name from where the response came from (softwareishard.com).
- Size of the response (171 B).
- Graphical timeline and load time info (80ms).
There is also a summary info at the bottom of the request list.

This summary simply says:
- The page initiated two requests.
- The size of the requested data is 222 B.
- The total page load time was 108 milliseconds (since the beginning of the first request to the end of the last request).
Not to forget, there is a message at the top of the list explaining that if the panel isn't enabled nothing is monitored. This is important since if the user isn't interested in HTTP tracking, there are no performance penalties if the panel is disabled.

This message is appended into the list of request every time the panel is disabled and enabled again so, it's obvious that some requests doesn't have to be displayed.
Net Request & Response Details
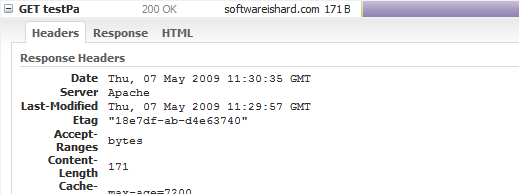
Every request entry can be expanded by clicking on the left hand plus button in order to see additional info. It's important to note that the entry actually represents both: the request sent to the server and also the response coming back. No matter if it comes from the server or the browser cache, one request-response round-trip is represented by one entry in the list.
Click on the following screenshot to see all headers.
The expanded body has following tabs:
- Headers - request and response HTTP headers
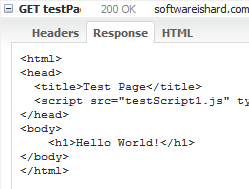
- Response - data returned from the server.
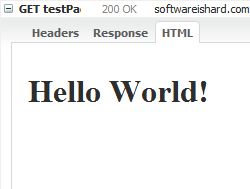
- HTML - preview of an HTML response (available only if the response is an HTML).
The other tabs look like as follows:
 |
 |
URL Parameters
If a network request uses a query string (URL parameters), another Params tab is available providing tabular info about all specified parameters.

The example above shows parameters for the following URL:
http://www.softwareishard.com/firebug/introduction/net-panel/testPage1.htm?param1=value1¶m2=value2
Clik here for live example.
POST & PUT Requests
If the requests is sending any data using POST or PUT HTTP method, there is another tab with sent data.
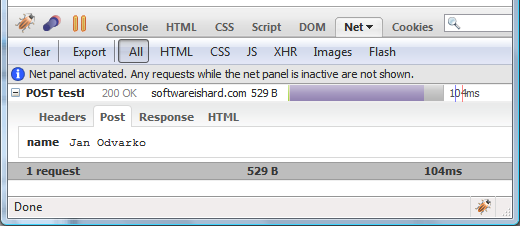
Click here for a live example.
JSON Responses
In case of a JSON response, there is yet another tab that uses expandable hierarchical tree to display all received data.
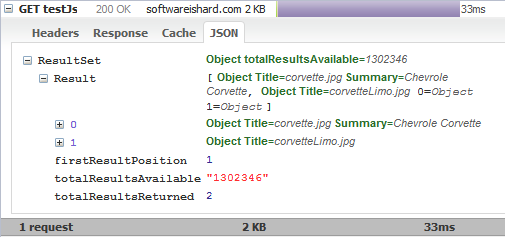
A live example is available.
Browser Cache
If a network response comes from the browser cache, there is a Cache tab, showing an info that is related to the appropriate cache-entry.
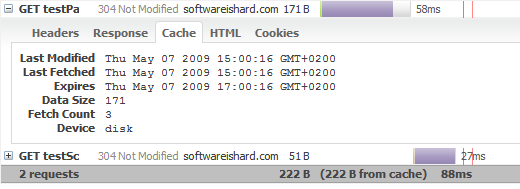
The image above shows a case when both requests came from the browser cache - response status is 304 Not Modified. Also, the summary row shows amount of data coming from the cache.
Further, there is following info:
- Last Modified - last time the cache entry was modified
- Last Fetched - last time the cache entry was opened
- Expires - expiration time of the cache entry
- Data Size - cache entry data size
- Fetch Count - number of times the cache entry has been opened
- Device - id for the device that stores this cache entry
Cookies
There can be also other tabs coming from Firebug extensions. An example is a Cookies tab that shows all send and received cookies for a request. This tab comes from a Firecookie extension.
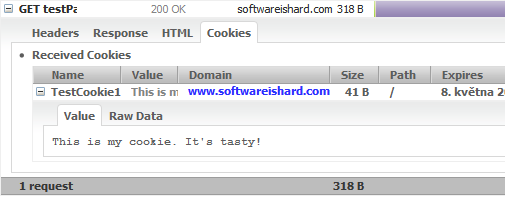
An example page is here.
Not to forget, in order to have this tab, you need the Firecookie extension installed.
Timeline
One of the most useful features for debugging page load performance is a request Timeline. Net panel uses this graphical representation to show request load in time together with timing data.
If you move mouse over the graph there is a detailed tooltip info. See the following screenshot:
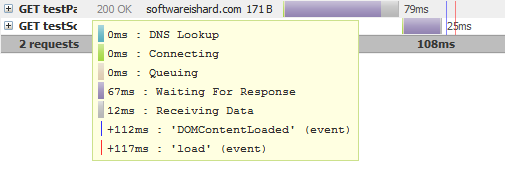
Every request-response round trip is composed from a several phases, represented by different color in the graph:
- DNS Lookup - DNS resolution time
- Connection - elapsed time required to create a TCP connection
- Queuing - elapsed time spent in a browser queue waiting for a network connection
- Waiting For Response - waiting for a response from the server
- Receiving Data - elapsed time required to read entire response from the server (and/
or time required to read from cache). - DomContentLoaded event - time when DomContentLoad event was fired (since the beginning of the request, can be negative if the request has been started after the event)
- load event - time when page load event was fired (since the beginning of the request, can be negative if the request has been started after the event)
See also a post dedicated to HTTP timings in Firebug 1.5.
Search
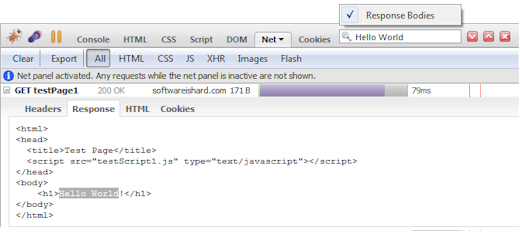
The net panel also uses Firebug's Search Box that can be used to search panel's content and also response bodies.
As you type into the Firebug search box, an option menu automatically pops up allowing to set a Response Bodies option so, the panel looks for the searched text even within returned responses. Entries automatically expand if the text is found inside and the occurrence is also selected in the UI. The search is automatically case sensitive if the searched text contains any capital letters.
Toolbar
Let's also quickly explain all the available toolbar buttons.
![]()
- Clear - removes all entries.
- Export* - Exports all HTTP tracing data into a HTTP Archive file (*.har)
- All (filter) - all requests are displayed.
- HTML (filter) - only HTML requests are displayed
- CSS (filter) - only CSS requests are displayed
- JS (filter) - only Javascript requests are displayed
- XHR (filter) - only dynamic requests (using XMLHttpRequest) are displayed
- Images (filter) - only image requests are displayed
- Flash (filter) - only Flash requests are displayed
* This action comes from a NetExport extension. All collected and computed data presented within the Net panel can be exported in HTTP Archive format (based on JSON). There is also a viewer that can be used to preview existing *.har files.
Context Menu
There is also several useful actions available in a request context menu. If you right click on a request entry you should see something like as follows (the list of actions depends on the type of clicked request):

- Copy Location - copy request URL into the clipboard
- Copy Request Headers - copy all request headers into the clipboard
- Copy Response Headers - copy all response headers into the clipboard
- Copy Response Body - copy response body into the clipboard
- Open in New Tab - open response in a new browser tab (the request can be sent to the server again)
- Open Response in New Tab - open response body in a new tab (cached response is always used)
