    async _getTopology() {
      let { data } = await getTopology();
      if (data && data.accountInfoList && data.accountInfoList.length) {
        data.nodes =
          (data &&
            data.accountInfoList &&
            data.accountInfoList.length &&
            data.accountInfoList.map((item, index) => {
              return {
                id: item.fenterpriseId,
                name: item.fenterpriseName,
                funifiedSocialCreditCode: item.funifiedSocialCreditCode,
                value: "",
                label: {
                  show: true,
                  position: "right",
                  formatter: "{b}",
                  borderRadius: 3,
                  padding: [6, 14],
                  color: index % 2 === 0 ? "#000" : "#fff",
                  backgroundColor: index % 2 === 0 ? "#00EDFF" : "#6F32FF"
                }
              };
            })) ||
          [];
        data.links = data.accountAisleRelationList;
        Object.assign(this.jsondata, data);
        this.initgxtu();
      }
    },
    initgxtu() {
      let that = this;
      var gxechart = echarts.init(document.getElementById("gxechart"));
      gxechart.showLoading();
      var graph = this.jsondata;
      gxechart.hideLoading();
      let gxoption = {
        tooltip: {},
        grid: {
          top: "0px",
          left: "50px",
          right: "50px",
          bottom: "0px",
           "auto", //图例宽度
          height: "90%" //图例高度
        },
        series: [
          {
            type: "graph",
            layout: "circular",
            data: graph.nodes,
            links: graph.links,
            categories: graph.categories,
            roam: true,
            edgeSymbol: ["circle", "arrow"],
            symbol: "circle",
            symbolSize: 15,
            labelLayout: {
              hideOverlap: true
            },
            layout: "force",
            force: {
              initLayout: "circular",
              repulsion: 1900,
              layoutAnimation: false
            },
            scaleLimit: {
              min: 0.4,
              max: 2
            },
            lineStyle: {
              color: "source",
              opacity: 0.2,
              curveness: 0.3
            },
            focusNodeAdjacency: true,
            legendHoverLink: true,
            itemStyle: {
              color: function(params) {
                if (params.dataIndex % 2 == 0) {
                  return "#00EDFF";
                }
                return "#6F32FF";
              }
            },
            emphasis: {
              focus: "adjacency",
              itemStyle: {
                shadowColor: "rgba(0, 0, 0, 0.4)",
                shadowBlur: 15
              },
              lineStyle: {
                 3
              }
            },
            left:-500
          }
        ]
      };
      gxechart.setOption(gxoption);
      gxechart.on("click", function(node) {
        if (node.dataType == "node") {
          that.nodeInfo = {
            name: node.name,
            funifiedSocialCreditCode: node.data.funifiedSocialCreditCode
          };
          that.entId = node.data.id;
          that.visible = true;
        }
      });
    },
其中,接口返回数据格式大致如下:

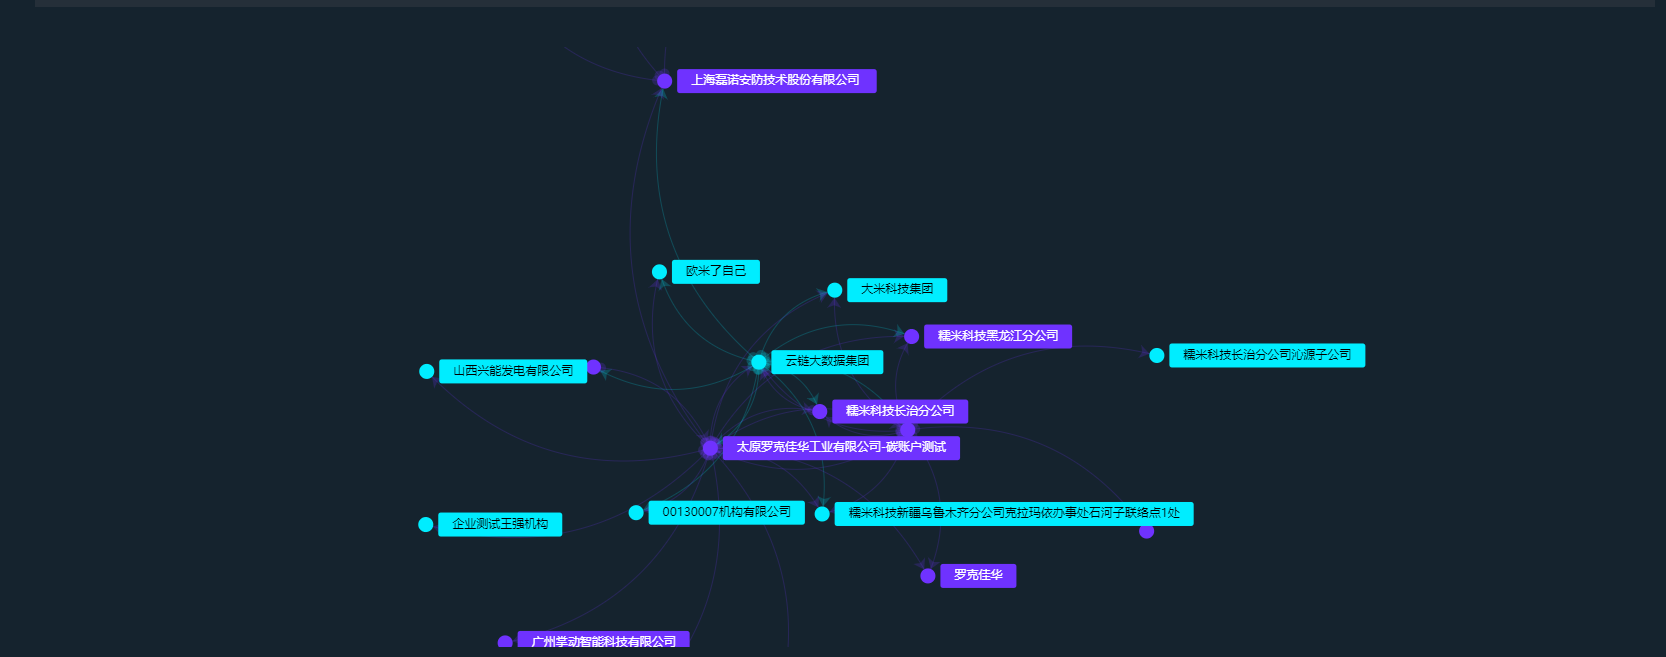
效果图如下: