vue+element项目,点击echarts图表在dialog弹框中显示具体的柱状图详情信息。控制台没有报错,但柱状图就是没出来
解决方案:
使用$nextTick拿到最新的dom,在他里面加载echarts实例
<div class="dialogBox">
	<el-dialog width="100%" :visible.sync="bankView" @close="handleClose" @open="open()" class="dialogbank">
		<div class="dialog-charts">
			<div class="dialog-title"><span>各项目排名统计TOP20</span></div>
			<div class="mg-chart" ref="mgcharts"></div>
		</div>
		<div class="dialog-table"></div>
	</el-dialog>
</div>
data() {
return {
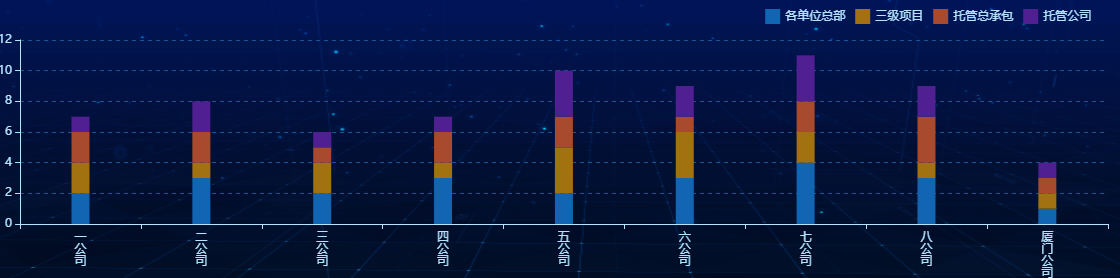
option: {
tooltip: {
trigger: 'axis',
axisPointer: { type: 'shadow' }
},
xAxis: [
{
type: 'category',
data: ['一公司', '二公司', '三公司', '四公司', '五公司', '六公司','七公司'],
axisLine: {
lineStyle: {color: "#B4E4FF"},
},
axisLabel: {
formatter: function(value) {
return value.split('').join('
');
}
}
}
],
series: [
{
name: '一级项目',
type: 'bar',
stack: true,
barWidth:18,
itemStyle:{
normal:{ color:'#1165b2'}
},
data: [2, 3, 2, 3, 2, 3, 4, 3, 1]
},
{
name: '三级项目',
type: 'bar',
stack: true,
itemStyle:{
normal:{ color:'#a27110'}
},
data: [2, 1, 2, 1, 3, 3, 2, 1, 1]
}
]
},
}
}
methods: {
     MgCharts() {
          let mycharts = this.$echarts.init(this.$refs.mgcharts);
          mycharts.setOption(this.option, true);
          window.addEventListener('resize', () => {
              mycharts.resize();
	 })
     },
     open() {
	  this.$nextTick(() => {
	      this.MgCharts();
           })
     }
}