1. Analyzing categorical data
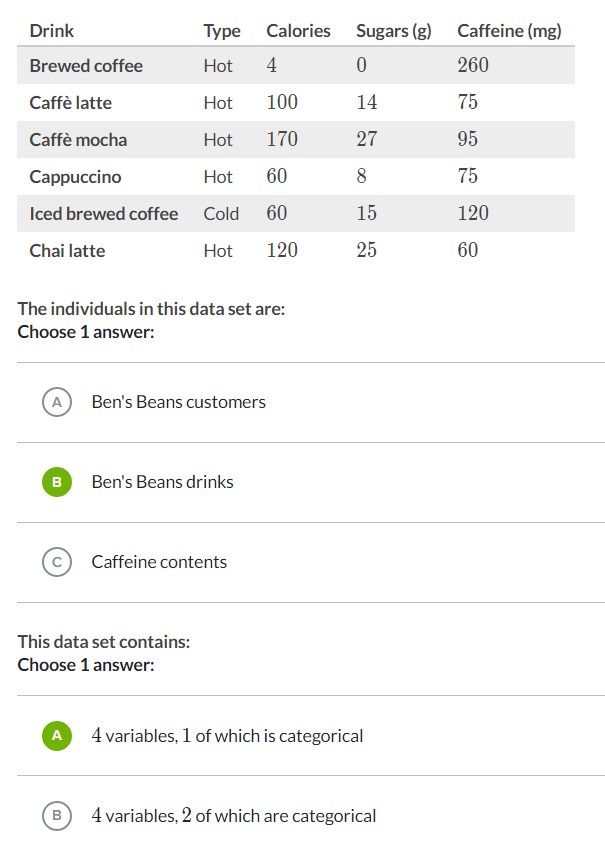
1.1 Identifying individuals, variables and categorical variables in a data set
Two types of variables are used in statistics: Quantitative and Categorical (also called qualitative). Quantitative variables are numerical variables: counts, percents, or numbers. Categorical variables are descriptions of groups or things, like “breeds of dog” or “voting preference”.

Quantitative variables can be counted, like the numbers on the deck of cards. 2,3,4,5,6... those were all quantitative. In other words they are numerical values.
General rule: if you can add it, it’s quantitative. For example, a G.P.A. of 3.3 and a G.P.A. of 4.0 can be added together (3.3 + 4.0 = 7.3), so that means it’s quantitative.
A deck of cards also has qualitative values. The qualitative values are descriptions. we have spades, clubs,diamonds, hearts, etc.
As a general rule, if you can’t add something, then it’s categorical. For example, you can’t add cat + dog, or Republican + Democrat.'
1.2 Distributions in 2-way tables.
There are our buckets for the amount of time studying. And also we create buckets for the percent correct. And then, we figure out what % of our entire student population falls into each of these categoreies. So for example, 2% of our students studied 21 to 40 minutes and got between 80 and 100% on the exam. This is a 2-way table. it's describing a joint distribution. You can view these as 2 variables. The time studied and the % correct.
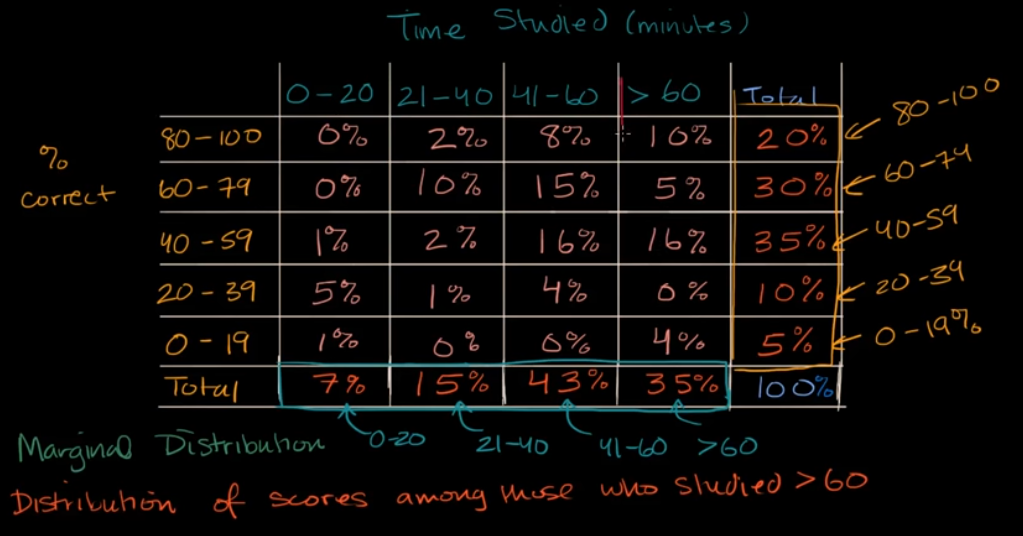
All we did is we totaled up each of these rows to 100. We total this rows and write it in the margin. This describes the distribution of the scores in the class. 20% of the students got 80 to 100% correct on that test. You don't know the breakdown by how much they actually studied.
There is another marginal distribution. the distribution of the amount of time people studied in the class. We could total up each of these columns. And this marginal distribution of the time studed.
The distribution of one variable given a bucket that you are falling into another variable. This is called a conditional distribution. becuase you are getting a distribution conditioned on a value of another variable.