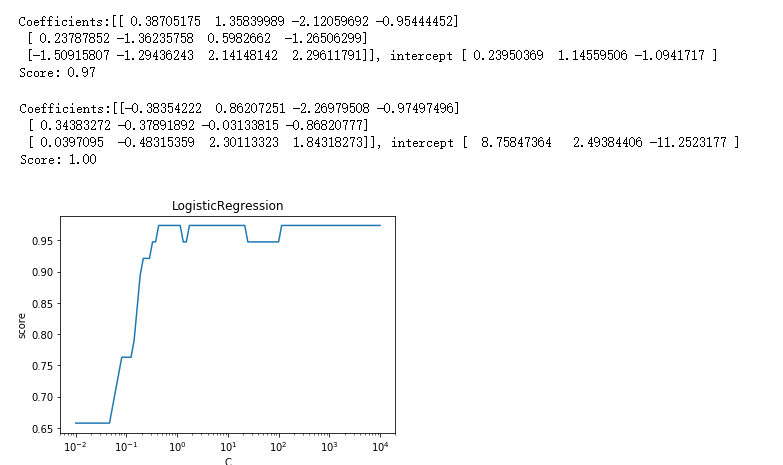
import numpy as np
import matplotlib.pyplot as plt

from matplotlib import cm
from mpl_toolkits.mplot3d import Axes3D
from sklearn import datasets, linear_model
from sklearn.model_selection import train_test_split

def load_data():
    # 使用 scikit-learn 自带的 iris 数据集
    iris=datasets.load_iris()
    X_train=iris.data
    y_train=iris.target
    return train_test_split(X_train, y_train,test_size=0.25,random_state=0,stratify=y_train)

#逻辑回归
def test_LogisticRegression(*data):
    X_train,X_test,y_train,y_test=data
    regr = linear_model.LogisticRegression()
    regr.fit(X_train, y_train)
    print('Coefficients:%s, intercept %s'%(regr.coef_,regr.intercept_))
    print('Score: %.2f' % regr.score(X_test, y_test))

# 加载用于分类的数据集
X_train,X_test,y_train,y_test=load_data()
# 调用  test_LogisticRegression
test_LogisticRegression(X_train,X_test,y_train,y_test)

def test_LogisticRegression_multinomial(*data):
    '''
    测试 LogisticRegression 的预测性能随 multi_class 参数的影响
    '''
    X_train,X_test,y_train,y_test=data
    regr = linear_model.LogisticRegression(multi_class='multinomial',solver='lbfgs')
    regr.fit(X_train, y_train)
    print('Coefficients:%s, intercept %s'%(regr.coef_,regr.intercept_))
    print('Score: %.2f' % regr.score(X_test, y_test))

# 调用  test_LogisticRegression_multinomial
test_LogisticRegression_multinomial(X_train,X_test,y_train,y_test)

def test_LogisticRegression_C(*data):
    '''
    测试 LogisticRegression 的预测性能随  C  参数的影响
    '''
    X_train,X_test,y_train,y_test=data
    Cs=np.logspace(-2,4,num=100)
    scores=[]
    for C in Cs:
        regr = linear_model.LogisticRegression(C=C)
        regr.fit(X_train, y_train)
        scores.append(regr.score(X_test, y_test))
    ## 绘图
    fig=plt.figure()
    ax=fig.add_subplot(1,1,1)
    ax.plot(Cs,scores)
    ax.set_xlabel(r"C")
    ax.set_ylabel(r"score")
    ax.set_xscale('log')
    ax.set_title("LogisticRegression")
    plt.show()

# 调用  test_LogisticRegression_C
test_LogisticRegression_C(X_train,X_test,y_train,y_test)