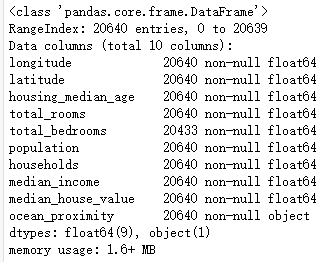
import pandas as pd
data_path = '/Users/chenyi/Documents/housing.csv'
housing = pd.read_csv(data_path)
housing.info()
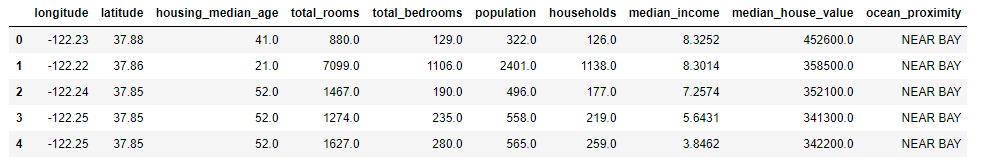
housing.head()
housing.describe()

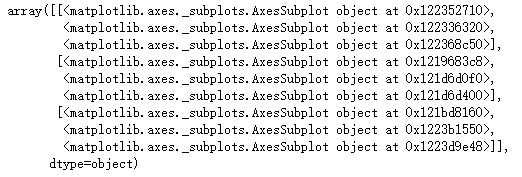
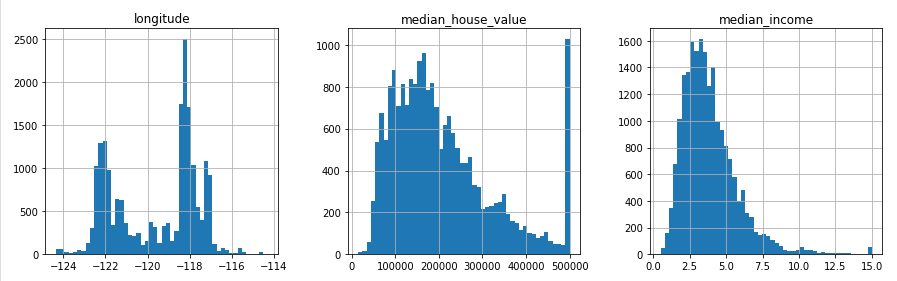
housing.hist(bins=50, figsize=(15,15))


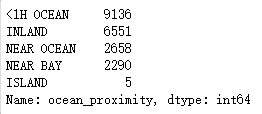
housing['ocean_proximity'].value_counts()
import seaborn as sns
total_count = housing['ocean_proximity'].value_counts()
plt.figure(figsize=(10,5))
sns.barplot(total_count.index, total_count.values, alpha=0.7)
plt.title("Ocean Proximity Summary")
plt.ylabel("Number of Occurences", fontsize=12)
plt.xlabel("Ocean of Proximity", fontsize=12)
plt.show()

print(housing.shape)

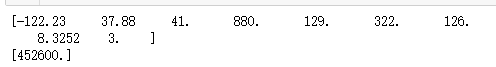
#将ocean_proximity转换为数值
housing['ocean_proximity'] = housing['ocean_proximity'].astype('category')
housing['ocean_proximity'] = housing['ocean_proximity'].cat.codes
#将median_house_value分离出来最为被预测数据
data = housing.values
train_data = data[:, [0,1,2,3,4,5,6,7,9]]
train_value = data[:,[8]]
print(train_data[0])
print(train_value[0])
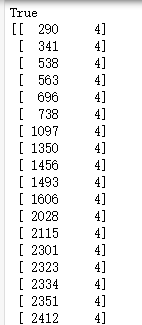
print(np.isnan(train_data).any())
print(np.argwhere(np.isnan(train_data)))
train_data[np.isnan(train_data)] = 0
print(np.isnan(train_data).any())
mean = train_data.mean(axis=0)
train_data -= mean
std = train_data.std(axis = 0)
train_data /= std
model = models.Sequential()
model.add(layers.Dense(64, activation='relu', input_shape=(train_data.shape[1],)))
model.add(layers.Dense(128, activation='relu'))
model.add(layers.Dense(128, activation='relu'))
model.add(layers.Dense(1))
model.compile(optimizer='rmsprop', loss='mse', metrics=['mae'])
history = model.fit(train_data, train_value, epochs=300,
                    validation_split=0.2,
                    batch_size=32)

val_mae_history = history.history['val_mean_absolute_error']
plt.plot(range(1, len(val_mae_history) + 1), val_mae_history)
plt.xlabel('Epochs')
plt.ylabel('Validation MAE')
plt.show()

def smooth_curve(points, factor=0.9):
    smoothed_points = []
    for point in points:
        if smoothed_points:
            previous = smoothed_points[-1]
            smoothed_points.append(previous * factor + point * (1 - factor))
        else:
            smoothed_points.append(point)
    return smoothed_points

smooth_mae_history = smooth_curve(val_mae_history)

plt.plot(range(1, len(smooth_mae_history)+1), smooth_mae_history)
plt.xlabel('Epochs')
plt.ylabel('Validation MAE')
plt.show()

import matplotlib.pyplot as plt
import matplotlib.ticker as plticker
try:
    from PIL import Image
except ImportError:
    import Image

# Open image file
image = Image.open('doggy.jpeg')
my_dpi=300.

# Set up figure
fig=plt.figure(figsize=(float(image.size[0])/my_dpi,float(image.size[1])/my_dpi),dpi=my_dpi)
ax=fig.add_subplot(111)

# Remove whitespace from around the image
fig.subplots_adjust(left=0,right=1,bottom=0,top=1)

# Set the gridding interval: here we use the major tick interval
myInterval=100.
loc = plticker.MultipleLocator(base=myInterval)
ax.xaxis.set_major_locator(loc)
ax.yaxis.set_major_locator(loc)

# Add the grid
ax.grid(which='major', axis='both', linestyle='-')

# Add the image
ax.imshow(image)

# Find number of gridsquares in x and y direction
nx=abs(int(float(ax.get_xlim()[1]-ax.get_xlim()[0])/float(myInterval)))
ny=abs(int(float(ax.get_ylim()[1]-ax.get_ylim()[0])/float(myInterval)))

# Add some labels to the gridsquares
for j in range(ny):
    y=myInterval/2+j*myInterval
    for i in range(nx):
        x=myInterval/2.+float(i)*myInterval
        ax.text(x,y,'{:d}'.format(i+j*nx),color='w',ha='center',va='center')

# Save the figure
fig.savefig('doggy.tiff',dpi=my_dpi)