前言:说起来GIS我觉得侧重于分析,渲染展示,做出来一些直观的专题图让人一眼就能了解数据的含义,今天结合的leaflet的插件实现数据的可视化,该插件可以做很多的功能,下面是一些地址:
api插件地址:https://github.com/humangeo/leaflet-dvf/wiki/6.-Markers#lstarmarker
在线引用地址:https://cdnjs.com/libraries/leaflet-dvf
关于一些饼状图、直方图demo展示:http://humangeo.github.io/leaflet-dvf/examples/html/markers.html
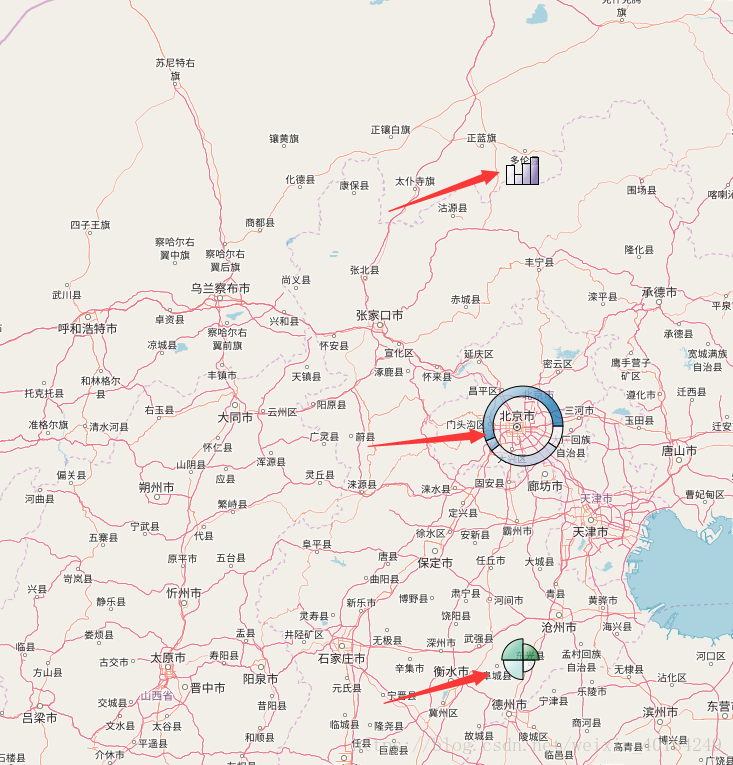
放张图:
一、关于js和css设置(我是在线引用的)
    <link href="../script/leaflet/leaflet.css" rel="stylesheet" />
    <link rel="stylesheet" href="https://cdnjs.cloudflare.com/ajax/libs/leaflet-dvf/0.3.1/css/dvf.css" integrity="sha256-Nd2GYmWjQVljoYgRUP2AWWniAYagCg1k7QhXa9N1kLg=" crossorigin="anonymous" />
    <script src="../script/leaflet/leaflet.js"></script>
    <script src="https://cdnjs.cloudflare.com/ajax/libs/leaflet-dvf/0.3.1/leaflet-dvf.js"></script>

    <style>
        #map {
             100%;
            height: 1000px;
        }
    </style>
二、关于饼状图、直方图使用(这里只解释直方图,其他类似)
       //直方图
        var colorValue = Math.random() * 360;
        //设置直方图的样式
        var options = {
            color: '#000',
            weight: 1,
            fillColor: 'hsl(' + colorValue + ',100%,50%)',
            radius: 20,
            fillOpacity: 0.7,
            rotation: 0.0,
            position: {
                x: 0,
                y: 0
            },
            offset: 0,
             8

        };
        //设置每个直方的数据
        options.data = {
            'dataPoint1': Math.random() * 20,
            'dataPoint2': Math.random() * 20,
            'dataPoint3': Math.random() * 20,
            'dataPoint4': Math.random() * 20
        };
       //设置每个直方的样式等
        options.chartOptions = {
            'dataPoint1': {
                fillColor: '#F2F0F7',
                minValue: 0,
                maxValue: 20,
                maxHeight: 30,
                displayText: function (value) {
                    return value.toFixed(2);
                }
            },
            'dataPoint2': {
                fillColor: '#CBC9E2',
                minValue: 0,
                maxValue: 20,
                maxHeight: 30,
                displayText: function (value) {
                    return value.toFixed(2);
                }
            },
            'dataPoint3': {
                fillColor: '#9E9AC8',
                minValue: -40,
                maxValue: 20,
                maxHeight: 30,
                displayText: function (value) {
                    return value.toFixed(2);
                }
            },
            'dataPoint4': {
                fillColor: '#6A51A3',
                minValue: 0,
                maxValue: 20,
                maxHeight: 30,
                displayText: function (value) {
                    return value.toFixed(2);
                }
            }
        };
        //声明一个直方图类对象
        var barChart = new L.BarChartMarker(new L.LatLng(41.92, 116.46), options);
        map.addLayer(barChart);
三、完整的demo
<!DOCTYPE html>
<html>
<head>
<meta charset="utf-8" />
<title>leaflet数据显示</title>
<link href="../script/leaflet/leaflet.css" rel="stylesheet" />
<link rel="stylesheet" href="https://cdnjs.cloudflare.com/ajax/libs/leaflet-dvf/0.3.1/css/dvf.css" integrity="sha256-Nd2GYmWjQVljoYgRUP2AWWniAYagCg1k7QhXa9N1kLg=" crossorigin="anonymous" />
<script src="../script/leaflet/leaflet.js"></script>
<script src="https://cdnjs.cloudflare.com/ajax/libs/leaflet-dvf/0.3.1/leaflet-dvf.js"></script>
<style>
#map {
100%;
height: 1000px;
}
</style>
</head>
<body>
<div id="map"></div>
<script>
var map = new L.Map('map', { center: [39.92, 116.46], zoom: 10, CRS: L.CRS.EPSG4326 });
L.tileLayer('http://{s}.tile.openstreetmap.org/{z}/{x}/{y}.png', {
attribution: 'Map data © <a href="http://www.osm.org">OpenStreetMap</a>'
}).addTo(map);
//饼状图显示
var colorValue = Math.random() * 360;
var options = {
color: '#000',
weight: 1,
fillColor: 'hsl(' + colorValue + ',100%,50%)',
radius: 40,
fillOpacity: 0.7,
rotation: 0.0,
position: {
x: 0,
y: 0
},
offset: 0,
numberOfSides: 50,
barThickness: 10
};
options.data = {
'猪肉': Math.random() * 20,
'羊肉': Math.random() * 20,
'牛肉': Math.random() * 20,
'鸡肉': Math.random() * 20
};
options.chartOptions = {
'猪肉': {
fillColor: '#F1EEF6',
minValue: 0,
maxValue: 20,
maxHeight: 20,
displayText: function (value) {
return value.toFixed(2);
}
},
'羊肉': {
fillColor: '#BDC9E1',
minValue: 0,
maxValue: 20,
maxHeight: 20,
displayText: function (value) {
return value.toFixed(2);
}
},
'牛肉': {
fillColor: '#74A9CF',
minValue: 0,
maxValue: 20,
maxHeight: 20,
displayText: function (value) {
return value.toFixed(2);
}
},
'鸡肉': {
fillColor: '#0570B0',
minValue: 0,
maxValue: 20,
maxHeight: 20,
displayText: function (value) {
return value.toFixed(2);
}
}
};
var pieChartMarker = new L.PieChartMarker(new L.LatLng(39.92, 116.46), options);
map.addLayer(pieChartMarker);
//Coxcom图
var colorValue = Math.random() * 360;
var options = {
color: '#000',
weight: 1,
fillColor: 'hsl(' + colorValue + ',100%,50%)',
radius: 30,
fillOpacity: 0.7,
rotation: 0.0,
position: {
x: 0,
y: 0
},
offset: 0,
numberOfSides: 50,
10
};
options.data = {
'dataPoint1': Math.random() * 20,
'dataPoint2': Math.random() * 20,
'dataPoint3': Math.random() * 20,
'dataPoint4': Math.random() * 20
};
options.chartOptions = {
'dataPoint1': {
fillColor: '#EDF8FB',
minValue: 0,
maxValue: 20,
maxHeight: 20,
displayText: function (value) {
return value.toFixed(2);
}
},
'dataPoint2': {
fillColor: '#B2E2E2',
minValue: 0,
maxValue: 20,
maxHeight: 20,
displayText: function (value) {
return value.toFixed(2);
}
},
'dataPoint3': {
fillColor: '#66C2A4',
minValue: 0,
maxValue: 20,
maxHeight: 20,
displayText: function (value) {
return value.toFixed(2);
}
},
'dataPoint4': {
fillColor: '#238B45',
minValue: 0,
maxValue: 20,
maxHeight: 20,
displayText: function (value) {
return value.toFixed(2);
}
}
};
var CoxcombChartMarker = new L.CoxcombChartMarker(new L.LatLng(37.92, 116.46), options);
map.addLayer(CoxcombChartMarker);
//直方图
var colorValue = Math.random() * 360;
var options = {
color: '#000',
weight: 1,
fillColor: 'hsl(' + colorValue + ',100%,50%)',
radius: 20,
fillOpacity: 0.7,
rotation: 0.0,
position: {
x: 0,
y: 0
},
offset: 0,
8
};
options.data = {
'dataPoint1': Math.random() * 20,
'dataPoint2': Math.random() * 20,
'dataPoint3': Math.random() * 20,
'dataPoint4': Math.random() * 20
};
options.chartOptions = {
'dataPoint1': {
fillColor: '#F2F0F7',
minValue: 0,
maxValue: 20,
maxHeight: 30,
displayText: function (value) {
return value.toFixed(2);
}
},
'dataPoint2': {
fillColor: '#CBC9E2',
minValue: 0,
maxValue: 20,
maxHeight: 30,
displayText: function (value) {
return value.toFixed(2);
}
},
'dataPoint3': {
fillColor: '#9E9AC8',
minValue: -40,
maxValue: 20,
maxHeight: 30,
displayText: function (value) {
return value.toFixed(2);
}
},
'dataPoint4': {
fillColor: '#6A51A3',
minValue: 0,
maxValue: 20,
maxHeight: 30,
displayText: function (value) {
return value.toFixed(2);
}
}
};
var barChart = new L.BarChartMarker(new L.LatLng(41.92, 116.46), options);
map.addLayer(barChart);
</script>
</body>
</html>四、总结
api插件本身不难,今天浪费了很多时间在这个插件显示上,后来才发现我下载的插件并不对,api本身都有错,该做引用官方的api在线地址,这才解决问题,真坑。