引言
- 这段时间来,看了西瓜书、蓝皮书,各种机器学习算法都有所了解,但在实践方面却缺乏相应的锻炼。于是我决定通过Kaggle这个平台来提升一下自己的应用能力,培养自己的数据分析能力。
- 我个人的计划是先从简单的数据集入手如手写数字识别、泰坦尼克号、房价预测,这些目前已经有丰富且成熟的方案可以参考,之后关注未来就业的方向如计算广告、点击率预测,有合适的时机,再与小伙伴一同参加线上比赛。
数据集
介绍
-
MNIST ("Modified National Institute of Standards and Technology")是计算机视觉中最典型的数据集之一,其一共包含训练集
train.csv,测试集test.csv和提交示例sample_submission.csv。csv是一种数据格式,以逗号作为文件的分隔值。 -
训练集
train.csv包含40000张28*28=784的图片,图片像素值为0-255,每张图片有对应的标签,其数据格式如下,可以看作是一个40000 * 785的矩阵,第一列存放标签;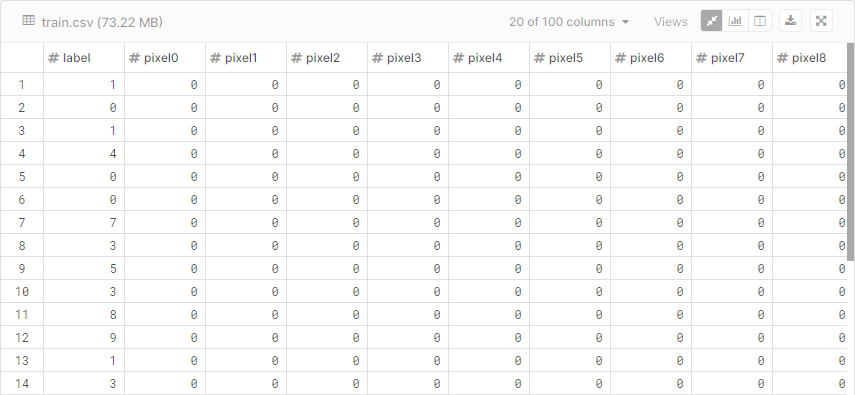
-
测试集
test.csv包含28000张28*28=784的图片,其不提供标签,矩阵维度为28000*784。
读取数据集
观察到不同方案中数据的读取方法各不同,这里小结一下。
- csv
  def loadTrainData():
      l=[]
      with open('/kaggle/input/digit-recognizer/train.csv') as file:
          lines = csv.reader(file)
          for line in lines:
              l.append(line)
- open
  # load csv files to numpy arrays
  def load_data(data_dir):
      train_data = open(data_dir + "train.csv").read()
- numpy
  def load_data(path):
      with np.load(path) as f:
          x_train, y_train = f['x_train'], f['y_train']
          x_test, y_test = f['x_test'], f['y_test']
          return (x_train, y_train), (x_test, y_test)
- panda
train = pd.read_csv('../input/train.csv')
K近邻算法KNN
- 这里不再介绍kNN的原理,贴一个简洁的实现,参考自https://blog.csdn.net/u012162613/article/details/41929171,其主要采用了二值化、L2范数作为距离度量。
实现A
  from numpy import *
  import csv

  # 读取训练集
  def loadTrainData():
      l=[]
      with open('/kaggle/input/digit-recognizer/train.csv') as file:
          lines = csv.reader(file)
          for line in lines:
              l.append(line)
          l.remove(l[0])
          l=array(l)
          data, label = l[:,1:], l[:,0]
          label = label[:,newaxis]
          a = normalizing(toInt(data))
          b = toInt(label)
          return a, b

  # 字符转整形
  def toInt(array):
      array = mat(array)
      m,n = shape(array)
      newArray = zeros((m,n))
      for i in range(m):
          for j in range(n):
              newArray[i,j]=int(array[i,j])
      return newArray

  # 二值化处理
  def normalizing(array):
      m,n = shape(array)
      for i in range(m):
          for j in range(n):
              if array[i,j] != 0:
                  array[i,j]=1
      return array

  # 加载测试集
  def loadTestData():
      l=[]
      with open('/kaggle/input/digit-recognizer/test.csv') as file:
          lines = csv.reader(file)
          for line in lines:
              l.append(line)
          l.remove(l[0])
          l=array(l)
          data=l
          return normalizing(toInt(data))

  def loadTestResult():
      l=[]
      with open('/kaggle/input/digit-recognizer/sample_submission.csv') as file:
          lines = csv.reader(file)
          for line in lines:
              l.append(line)
          l.remove(l[0])
          l=array(l)
          label=l[:,1]
          label = label[:, newaxis]
          return toInt(label)

  # 保存结果
  def saveResult(result):
      with open('/kaggle/working/knn.csv', 'w', newline='') as myFile:
          myWriter = csv.writer(myFile)
          myWriter.writerow(['ImageId','Label'])
          for i, label in enumerate(result):
              tmp = [i+1, int(label)]
              myWriter.writerow(tmp)

  # kNN分类
  def classify(inX, dataSet, labels, k):
      inX = mat(inX)
      dataSet = mat(dataSet)
      labels = mat(labels)
      dataSetSize = dataSet.shape[0]
      diffMat = tile(inX, (dataSetSize, 1)) - dataSet

      spDiffMat = array(diffMat) ** 2
      spDistances = spDiffMat.sum(axis=1)

  	#计算L2距离
      distances = spDistances ** 0.5
      sortedDistIndicies = distances.argsort()
      classCount = {}
      for i in range(k):
          voteIlabel = labels[sortedDistIndicies[i],0]
          classCount[voteIlabel] = classCount.get(voteIlabel,0) + 1
      sortedClassCount = sorted(classCount.items(), key=lambda item:item[1], reverse=True)
      return sortedClassCount[0][0]

  # 主函数
  def handwritingClassTest():
      trainData,trainLabel=loadTrainData()
      testData =loadTestData()
      testLabel = loadTestResult()
      m,n=shape(testData)
      errorCount=0
      resultList=[]
      for i in range(m):
          classifierResult = classify(testData[i], trainData, trainLabel, 1)
          resultList.append(classifierResult)
          print("the classifier for %d came back with: %d, the real answer is: %d" % (i, classifierResult, testLabel[i]))
          if (classifierResult != testLabel[i]): errorCount += 1.0
      print("
the total number of errors is: %d" % errorCount)
      print("
the total error rate is: %f" % (errorCount/float(m)))
      saveResult(resultList)

  handwritingClassTest()
- 结果:k=5,准确率96.40%;k=1,准确率96.27%。PS:按照个人理解,K值越小,结果应该更高才对。随后我换了另一个实现,其采用了numpy实现矩阵计算,运行速度比上面的代码块多了。
实现B
  import numpy as np
  import matplotlib.pyplot as plt
  from collections import Counter
  import time

  %matplotlib inline
  plt.rcParams['figure.figsize'] = (10.0, 8.0) # set default size of plots
  plt.rcParams['image.interpolation'] = 'nearest'
  plt.rcParams['image.cmap'] = 'gray'

  # load csv files to numpy arrays
  def load_data(data_dir):
      train_data = open(data_dir + "train.csv").read()
      train_data = train_data.split("
")[1:-1]
      train_data = [i.split(",") for i in train_data]
      # print(len(train_data))
      X_train = np.array([[int(i[j]) for j in range(1,len(i))] for i in train_data])
      y_train = np.array([int(i[0]) for i in train_data])

      # print(X_train.shape, y_train.shape)

      test_data = open(data_dir + "test.csv").read()
      test_data = test_data.split("
")[1:-1]
      test_data = [i.split(",") for i in test_data]
      # print(len(test_data))
      X_test = np.array([[int(i[j]) for j in range(0,len(i))] for i in test_data])

      # print(X_test.shape)

      return X_train, y_train, X_test


  class simple_knn():
      "a simple kNN with L2 distance"

      def __init__(self):
          pass

      def train(self, X, y):
          self.X_train = X
          self.y_train = y

      def predict(self, X, k=1):
          dists = self.compute_distances(X)
          # print("computed distances")

          num_test = dists.shape[0]
          y_pred = np.zeros(num_test)

          for i in range(num_test):
              k_closest_y = []
              labels = self.y_train[np.argsort(dists[i,:])].flatten()
              # find k nearest lables
              k_closest_y = labels[:k]

              # out of these k nearest lables which one is most common
              # for 5NN [1, 1, 1, 2, 3] returns 1
              # break ties by selecting smaller label
              # for 5NN [1, 2, 1, 2, 3] return 1 even though 1 and 2 appeared twice.
              c = Counter(k_closest_y)
              y_pred[i] = c.most_common(1)[0][0]

          return(y_pred)

      def compute_distances(self, X):
          num_test = X.shape[0]
          num_train = self.X_train.shape[0]

          dot_pro = np.dot(X, self.X_train.T)
          sum_square_test = np.square(X).sum(axis = 1)
          sum_square_train = np.square(self.X_train).sum(axis = 1)
          dists = np.sqrt(-2 * dot_pro + sum_square_train + np.matrix(sum_square_test).T)

          return(dists)
  # runs for 13 minutes
  predictions = []

  for i in range(int(len(X_test)/(2*batch_size))):
      # predicts from i * batch_size to (i+1) * batch_size
      print("Computing batch " + str(i+1) + "/" + str(int(len(X_test)/batch_size)) + "...")
      tic = time.time()
      predts = classifier.predict(X_test[i * batch_size:(i+1) * batch_size], k)
      toc = time.time()
      predictions = predictions + list(predts)
  #     print("Len of predictions: " + str(len(predictions)))
      print("Completed this batch in " + str(toc-tic) + " Secs.")

  print("Completed predicting the test data.")

  # runs for 13 minutes
  # uncomment predict lines to predict second half of test data

  for i in range(int(len(X_test)/(2*batch_size)), int(len(X_test)/batch_size)):
      # predicts from i * batch_size to (i+1) * batch_size
      print("Computing batch " + str(i+1) + "/" + str(int(len(X_test)/batch_size)) + "...")
      tic = time.time()
      predts = classifier.predict(X_test[i * batch_size:(i+1) * batch_size], k)
      toc = time.time()
      predictions = predictions + list(predts)
  #     print("Len of predictions: " + str(len(predictions)))
      print("Completed this batch in " + str(toc-tic) + " Secs.")

  print("Completed predicting the test data.")

  out_file = open("predictions.csv", "w")
  out_file.write("ImageId,Label
")
  for i in range(len(predictions)):
      out_file.write(str(i+1) + "," + str(int(predictions[i])) + "
")
  out_file.close()
- 结果:K=5,96.90%,k=1,97.11%;相同的k值,实现B的准确率比实现A要高,原因是实现B未采用二值化,保留了更多的数字图像信息。
卷积神经网络CNN
- 这里主要基于Pytorch实现。
数据加载
- 这里transform的作用是将PIL图片转化为Tensor,并进行归一化。具体可参考:https://zhuanlan.zhihu.com/p/27382990
  # Construct the transform
  import torchvision.transforms as transforms
  from   PIL import Image
  transform = transforms.Compose([
          transforms.ToTensor(),
          transforms.Normalize((0.5,), (0.5,))
      ])

  # Get the device we're training on
  device = torch.device("cuda" if torch.cuda.is_available() else "cpu")

  def get_digits(df):
      """Loads images as PyTorch tensors"""
      # Load the labels if they exist
      # (they wont for the testing data)
      labels = []
      start_inx = 0
      if 'label' in df.columns:
          labels = [v for v in df.label.values]
          start_inx = 1

      # Load the digit information
      digits = []
      for i in range(df.pixel0.size):
          digit = df.iloc[i].astype(float).values[start_inx:]
          digit = np.reshape(digit, (28,28))
          digit = transform(digit).type('torch.FloatTensor')
          if len(labels) > 0:
              digits.append([digit, labels[i]])
          else:
              digits.append(digit)

      return digits
- SubsetRandomSampler对数据进行随机划分,num_workers采用多线程加载数据。可参考:https://stackoverflow.com/questions/53998282/how-does-the-number-of-workers-parameter-in-pytorch-dataloader-actually-work
  # Load the training data
  train_X = get_digits(train)

  # Some configuration parameters
  num_workers = 0    # number of subprocesses to use for data loading
  batch_size  = 64   # how many samples per batch to load
  valid_size  = 0.2  # percentage of training set to use as validation

  # Obtain training indices that will be used for validation
  num_train = len(train_X)
  indices   = list(range(num_train))
  np.random.shuffle(indices)
  split     = int(np.floor(valid_size * num_train))
  train_idx, valid_idx = indices[split:], indices[:split]

  # Define samplers for obtaining training and validation batches
  from torch.utils.data.sampler import SubsetRandomSampler
  train_sampler = SubsetRandomSampler(train_idx)
  valid_sampler = SubsetRandomSampler(valid_idx)

  # Construct the data loaders
  train_loader = torch.utils.data.DataLoader(train_X, batch_size=batch_size,
                      sampler=train_sampler, num_workers=num_workers)
  valid_loader = torch.utils.data.DataLoader(train_X, batch_size=batch_size,
                      sampler=valid_sampler, num_workers=num_workers)

  # Test the size and shape of the output
  dataiter = iter(train_loader)
  images, labels = dataiter.next()
  print(type(images))
  print(images.shape)
  print(labels.shape)
网络模型
- 网络的结果主要分为
cnn_layers和fc_layers,个人认为fc_layers有些繁杂。
  # Import the necessary modules
  import torch.nn as nn

  def calc_out(in_layers, stride, padding, kernel_size, pool_stride):
      """
      Helper function for computing the number of outputs from a
      conv layer
      """
      return int((1+(in_layers - kernel_size + (2*padding))/stride)/pool_stride)

  # define the CNN architecture
  class Net(nn.Module):
      def __init__(self):
          super(Net, self).__init__()

          # Some helpful values
          inputs      = [1,32,64,64]
          kernel_size = [5,5,3]
          stride      = [1,1,1]
          pool_stride = [2,2,2]

          # Layer lists
          layers = []

          self.out   = 28
          self.depth = inputs[-1]
          for i in range(len(kernel_size)):
              # Get some variables
              padding = int(kernel_size[i]/2)

              # Define the output from this layer
              self.out = calc_out(self.out, stride[i], padding,
                                  kernel_size[i], pool_stride[i])

              # convolutional layer 1
              layers.append(nn.Conv2d(inputs[i], inputs[i], kernel_size[i],
                                         stride=stride[i], padding=padding))
              layers.append(nn.ReLU())

              # convolutional layer 2
              layers.append(nn.Conv2d(inputs[i], inputs[i+1], kernel_size[i],
                                         stride=stride[i], padding=padding))
              layers.append(nn.ReLU())
              # maxpool layer
              layers.append(nn.MaxPool2d(pool_stride[i],pool_stride[i]))
              layers.append(nn.Dropout(p=0.2))

          self.cnn_layers = nn.Sequential(*layers)

          print(self.depth*self.out*self.out)

          # Now for our fully connected layers
          layers2 = []
          layers2.append(nn.Dropout(p=0.2))
          layers2.append(nn.Linear(self.depth*self.out*self.out, 512))
          layers2.append(nn.Dropout(p=0.2))
          layers2.append(nn.Linear(512, 256))
          layers2.append(nn.Dropout(p=0.2))
          layers2.append(nn.Linear(256, 256))
          layers2.append(nn.Dropout(p=0.2))
          layers2.append(nn.Linear(256, 10))

          self.fc_layers = nn.Sequential(*layers2)

          self.fc_last = nn.Linear(self.depth*self.out*self.out, 10)

      def forward(self, x):
          x = self.cnn_layers(x)
          x = x.view(-1, self.depth*self.out*self.out)
          x = self.fc_layers(x)
  #        x = self.fc_last(x)

          return x

  # create a complete CNN
  model = Net()
  model
模型训练
- 定义优化器,这里采用Adam。
  import torch.optim as optim

  # specify loss function
  criterion = nn.CrossEntropyLoss()

  # specify optimizer
  optimizer = optim.Adam(model.parameters(), lr=0.0005)
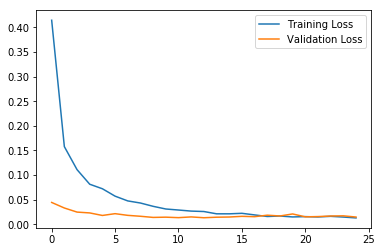
- 采用交叉验证法,即从训练集中划分一定比例的验证集作为评价标准,防止过拟合。
  # number of epochs to train the model
  n_epochs = 25 # you may increase this number to train a final model

  valid_loss_min = np.Inf # track change in validation loss

  # Additional rotation transformation
  #rand_rotate = transforms.Compose([
  #    transforms.ToPILImage(),
  #    transforms.RandomRotation(20),
  #    transforms.ToTensor()
  #])

  # Get the device
  print(device)
  model.to(device)
  tLoss, vLoss = [], []
  for epoch in range(n_epochs):

      # keep track of training and validation loss
      train_loss = 0.0
      valid_loss = 0.0

      #########
      # train #
      #########
      model.train()
      for data, target in train_loader:
          # move tensors to GPU if CUDA is available
          data   = data.to(device)
          target = target.to(device)

          # clear the gradients of all optimized variables
          optimizer.zero_grad()
          # forward pass: compute predicted outputs by passing inputs to the model
          output = model(data)
          # calculate the batch loss
          loss = criterion(output, target)
          # backward pass: compute gradient of the loss with respect to model parameters
          loss.backward()
          # perform a single optimization step (parameter update)
          optimizer.step()
          # update training loss
          train_loss += loss.item()*data.size(0)

      ############
      # validate #
      ############
      model.eval()
      for data, target in valid_loader:
          # move tensors to GPU if CUDA is available
          data   = data.to(device)
          target = target.to(device)
          # forward pass: compute predicted outputs by passing inputs to the model
          output = model(data)
          # calculate the batch loss
          loss = criterion(output, target)
          # update average validation loss
          valid_loss += loss.item()*data.size(0)

      # calculate average losses
      train_loss = train_loss/len(train_loader.dataset)
      valid_loss = valid_loss/len(valid_loader.dataset)
      tLoss.append(train_loss)
      vLoss.append(valid_loss)

      # print training/validation statistics
      print('Epoch: {} 	Training Loss: {:.6f} 	Validation Loss: {:.6f}'.format(
          epoch, train_loss, valid_loss))

      # save model if validation loss has decreased
      if valid_loss <= valid_loss_min:
          print('Validation loss decreased ({:.6f} --> {:.6f}).  Saving model ...'.format(
          valid_loss_min,
          valid_loss))
          torch.save(model.state_dict(), 'model_cifar.pt')
          valid_loss_min = valid_loss
- 绘制Loss曲线
  # Plot the resulting loss over time
  plt.plot(tLoss, label='Training Loss')
  plt.plot(vLoss, label='Validation Loss')
  plt.legend();
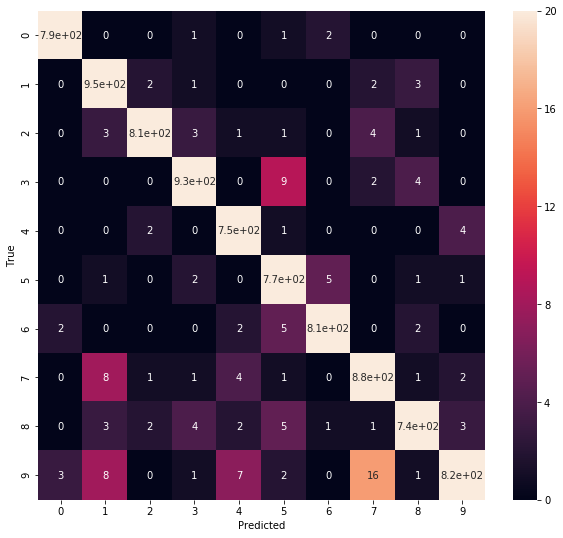
训练结果
-
这里只展示模型在验证集上的结果,采用混淆矩阵表示(Confusion Matrix)。
-
该矩阵中((i,j))表示原本为(i)的样本被判定为(j)的数目。理想情况不存在误判,只有对角线上有值,其他部分为0。但我们的结果显示多多少少存在一些误判,比如((9,4))表示原本为9的样本被误判为了4,这可以理解,因为4和9确实很相近。
测试结果
- 加载训练权重
model.load_state_dict(torch.load('model_cifar.pt'));
- 加载测试集
  # Define the test data loader
  test        = pd.read_csv("../input/digit-recognizer/test.csv")
  test_X      = get_digits(test)
  test_loader = torch.utils.data.DataLoader(test_X, batch_size=batch_size,
                                            num_workers=num_workers)
- 预测并保存结果
  # Create storage objects
  ImageId, Label = [],[]

  # Loop through the data and get the predictions
  for data in test_loader:
      # Move tensors to GPU if CUDA is available
      data = data.to(device)
      # Make the predictions
      output = model(data)
      # Get the most likely predicted digit
      _, pred = torch.max(output, 1)

      for i in range(len(pred)):
          ImageId.append(len(ImageId)+1)
          Label.append(pred[i].cpu().numpy())

  sub = pd.DataFrame(data={'ImageId':ImageId, 'Label':Label})
  sub.describe

  # Write to csv file ignoring index column
  sub.to_csv("submission.csv", index=False)
- 最终的结果是98.90%,比KNN要高接近两个点,而我将网络模型中的
fc_layers替换成一层普通的全连接层后,结果变成了99.21%。
降维Dimensionality Reduction
- 在高维数据下,算法的性能可能会变得很差,即维度灾难。因此我们使用降维方法将数据从高维投影到低维,这样学习算法将会简单很多。
主成干分析PCA
-
PCA是一类线性变换,将原始特征投射到子空间并且尽可能保留信息。因此算法尝试寻找最合适的方向和角度(即主成分)来最大化子空间的方差。
-
算法
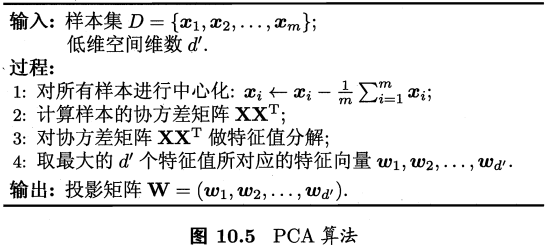
-
实现
# Standardize the data from sklearn.preprocessing import StandardScaler X = train.values X_std = StandardScaler().fit_transform(X) # Calculating Eigenvectors and eigenvalues of Cov matirx mean_vec = np.mean(X_std, axis=0) cov_mat = np.cov(X_std.T) eig_vals, eig_vecs = np.linalg.eig(cov_mat) # Create a list of (eigenvalue, eigenvector) tuples eig_pairs = [ (np.abs(eig_vals[i]),eig_vecs[:,i]) for i in range(len(eig_vals))] # Sort the eigenvalue, eigenvector pair from high to low eig_pairs.sort(key = lambda x: x[0], reverse= True) # Calculation of Explained Variance from the eigenvalues tot = sum(eig_vals) var_exp = [(i/tot)*100 for i in sorted(eig_vals, reverse=True)] # Individual explained variance cum_var_exp = np.cumsum(var_exp) # Cumulative explained variance -
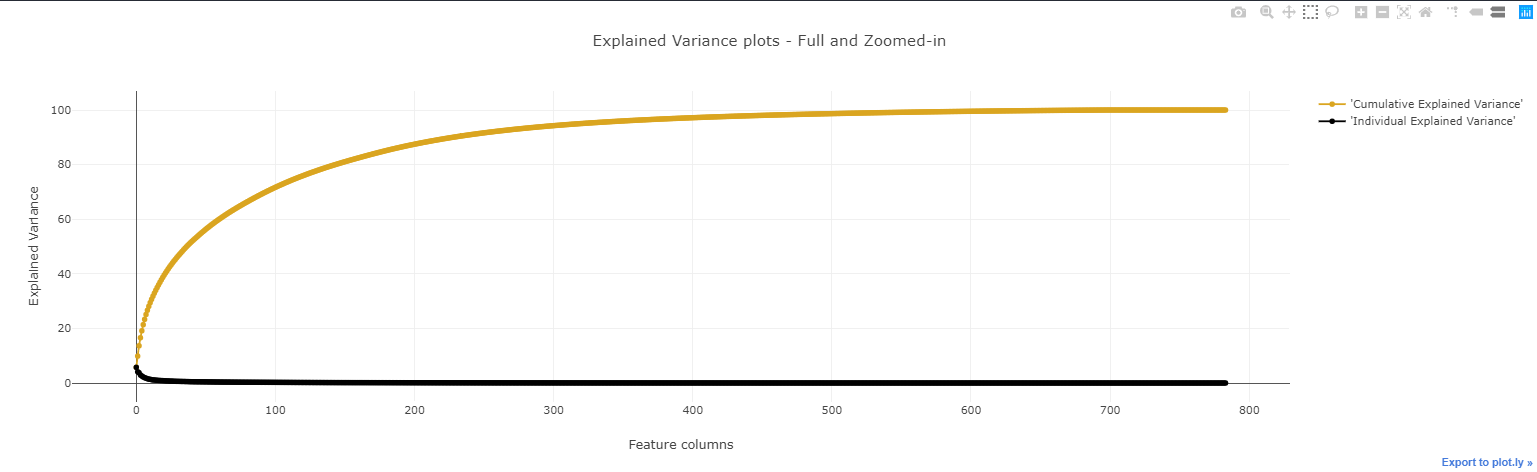
可视化
- 单独的方差(黑色)随着维度增大而减小,累计方差随着维度的增大而饱和。90%的方差可用前200个维度来表示。
-
可视化PCA找到的前30个最大方差方向上的特征值。
# Invoke SKlearn's PCA method
n_components = 30
pca = PCA(n_components=n_components).fit(train.values)

eigenvalues = pca.components_.reshape(n_components, 28, 28)

# Extracting the PCA components ( eignevalues )
#eigenvalues = pca.components_.reshape(n_components, 28, 28)
eigenvalues = pca.components_

n_row = 4
n_col = 7

# Plot the first 8 eignenvalues
plt.figure(figsize=(13,12))
for i in list(range(n_row * n_col)):
    offset =0
    plt.subplot(n_row, n_col, i + 1)
    plt.imshow(eigenvalues[i].reshape(28,28), cmap='jet')
    title_text = 'Eigenvalue ' + str(i + 1)
    plt.title(title_text, size=6.5)
    plt.xticks(())
    plt.yticks(())
plt.show()
-
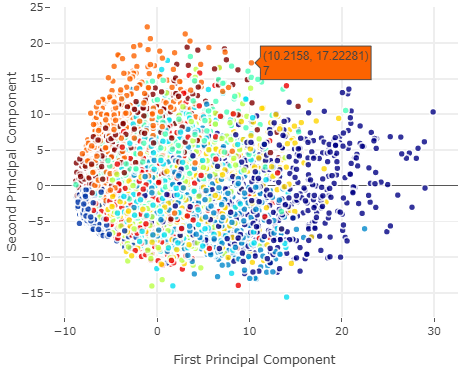
用5个特征做PCA并可视化前2个特征(代码略),数据点被分为几个集群,每个集群就是一类数字。
-
由于PCA是无监督方法,这里也没有提供标签,于是我们接着采用K-means聚类算法并可视化。
from sklearn.cluster import KMeans # KMeans clustering
# Set a KMeans clustering with 9 components ( 9 chosen sneakily ;) as hopefully we get back our 9 class labels)
kmeans = KMeans(n_clusters=9)
# Compute cluster centers and predict cluster indices
X_clustered = kmeans.fit_predict(X_5d)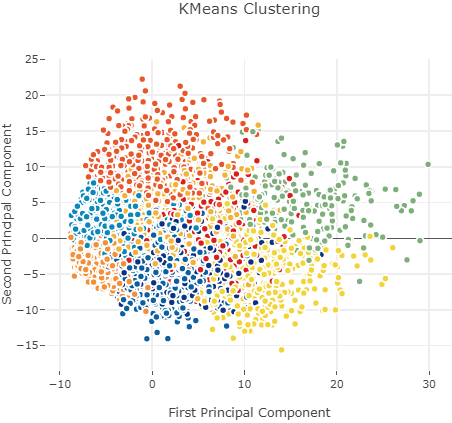
线性判别分析LDA
参考https://www.cnblogs.com/pinard/p/6244265.html
-
LDA跟PCA一样,也采用线性降维,但其是监督的。
-
算法过程如下

-
实现、可视化
lda = LDA(n_components=5)
# Taking in as second argument the Target as labels
X_LDA_2D = lda.fit_transform(X_std, Target.values )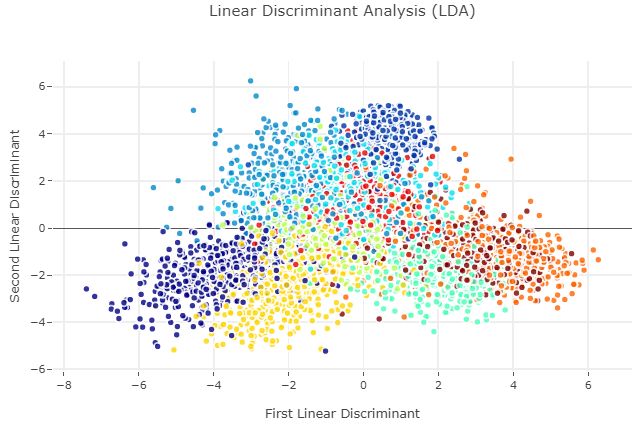
-
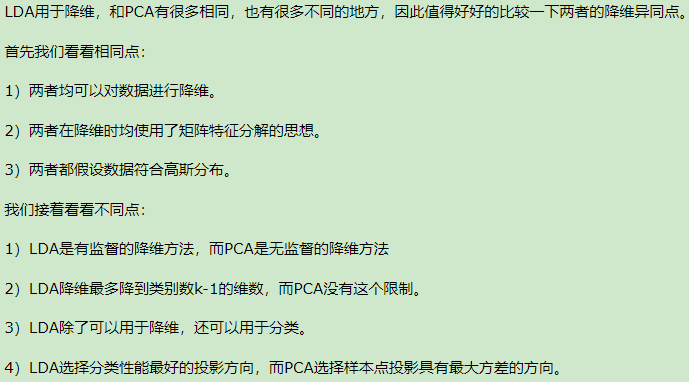
LDA vs PCA
t-SNE(t-Distributed Stochastic Neighbour Embedding)
- 不同于PCA、LDA,t-SNE是非线性、基于概率的降维方法。
- 算法不同于寻找最大信息分离的方向,t-SNE将欧氏距离转化为条件概率,然后对概率应用t分布。概率应用衡量数据点之间的相似性。
- 实现、可视化
  # Invoking the t-SNE method
  tsne = TSNE(n_components=2)
  tsne_results = tsne.fit_transform(X_std)
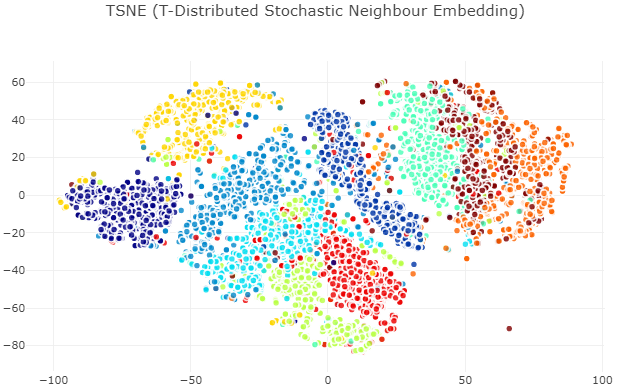
- 相比PCA、LDA,数据点被更直观的分离,t-SNE更好地保留了数据的拓扑信息,但t-SNE的缺点是识别集群会出现多个局部极小点,可见颜色相同的集群被分为两个子群。