一、Elasticsearch 安装
1、部署系统以及环境准备
cat /etc/redhat-release
CentOS Linux release 7.4.1708 (Core)
uname -r
3.10.0-693.el7.x86_64

#Firewalld and selinux
systemctl stop firewalld
systemctl disable firewalld
sed -i 's/SELINUX=enforcing/SELINUX=disabled/g' /etc/selinux/config
setenforce 0


sed -i 's/localhost.localdomain/ELK.localdomain/' /etc/hostname
hostnamectl set-hostname  ELK.localdomain


安装jdk8以上版本
mkdir /application/
tar xf jdk-8u151-linux-x64.tar.gz -C /application/
ln -s /application/jdk1.8.0_151 /application/jdk
sed -i.ori '$a export JAVA_HOME=/application/jdk
export PATH=$JAVA_HOME/bin:$JAVA_HOME/jre/bin:$PATH
export CLASSPATH=.$CLASSPATH:$JAVA_HOME/lib:$JAVA_HOME/jre/lib:$JAVA_HOME/lib/tools.jar' /etc/profile
source /etc/profile

java -version
java version "1.8.0_151"
Java(TM) SE Runtime Environment (build 1.8.0_151-b12)
Java HotSpot(TM) 64-Bit Server VM (build 25.151-b12, mixed mode)


2、部署elasticsearch6.3.2
采用压缩包解压缩安装方式启动服务
创建另外独立账户专供es使用
cd /usr/local
wget https://artifacts.elastic.co/downloads/elasticsearch/elasticsearch-6.3.2.tar.gz
tar zxvf elasticsearch-6.3.2.tar.gz -C /application/
groupadd ela 创建ela组
useradd -g ela ela 创建ela用户,并且加入ela组
passwd ela 为ela用户设定登录密码

ln -s /application/elasticsearch-6.3.2/ /application/elasticsearch
chown -R ela.ela /application/elasticsearch

配置文件
grep -n '^[a-Z]' /application/elasticsearch/config/elasticsearch.yml
17:cluster.name: elk
23:node.name: node-1
33:path.data: /home/elkdata
37:path.logs: /var/log/elasticsearch
42:bootstrap.memory_lock: true
54:network.host: 0.0.0.0
58:http.port: 9200
88:http.cors.enabled: true
89:http.cors.allow-origin: "*"


mkdir /home/elkdata/ -p
chown -R ela.ela /home/elkdata/
mkdir /var/log/elasticsearch -p
chown -R ela.ela /var/log/elasticsearch/


vim /etc/security/limits.conf #增加以下行
* soft nofile 65536
* hard nofile 131072
ela soft memlock unlimited
ela hard memlock unlimited

让设置生效重启系统或者另外开一个终端


vim /etc/sysctl.conf
#增加一行
vm.max_map_count = 655360
sysctl -p

检查文件权限是否是ela用户
ls -l /application/elasticsearch-6.3.2/
ls -l /application/elasticsearch/
ls -l /application/elasticsearch/config/jvm.options


切换到ela用户,-d后台运行
[ela@elk elasticsearch-6.3.2]$ ./bin/elasticsearch -d

[ela@elk elasticsearch-6.3.2]$ netstat -ntpl|grep 9200
(Not all processes could be identified, non-owned process info
 will not be shown, you would have to be root to see it all.)
tcp6       0      0 :::9200                 :::*                    LISTEN      147438/java
二、Kibana安装
#下载
cd /usr/local/src
wget https://artifacts.elastic.co/downloads/kibana/kibana-6.3.2-linux-x86_64.tar.gz
#解压
tar xzvf kibana-6.3.2-linux-x86_64.tar.gz

ln -s /application/kibana-6.3.2-linux-x86_64 /application/kibana


vim /application/kibana/config/kibana.yml
#端口
server.port: 5601

#服务器IP
server.host: "10.10.114.4"

#elasticsearch服务器
elasticsearch.url: "http://10.10.114.4:9200"

启动
nohup bin/kibana &


查看端口占用命令
netstat -apn |grep 5601
#杀掉进程
kill -9 进程号
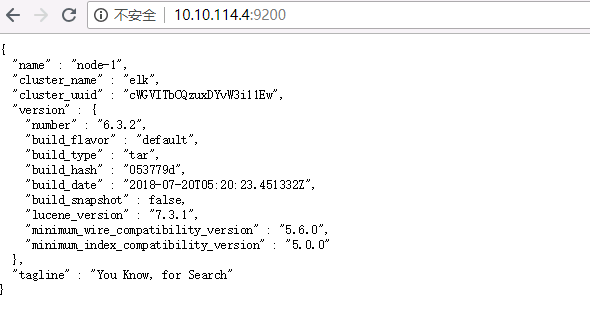
浏览器访问:http://ip:5601
kibana-6.3.0版本以后新增index索引不支持常用的正则匹配了,只能使用【*】

三、Logstash安装
另外一台10.10.114.2安装Logstash
mkdir /application/
tar xf jdk-8u151-linux-x64.tar.gz -C /application/
ln -s /application/jdk1.8.0_151 /application/jdk
sed -i.ori '$a export JAVA_HOME=/application/jdk
export PATH=$JAVA_HOME/bin:$JAVA_HOME/jre/bin:$PATH
export CLASSPATH=.$CLASSPATH:$JAVA_HOME/lib:$JAVA_HOME/jre/lib:$JAVA_HOME/lib/tools.jar' /etc/profile
source /etc/profile

tar xf logstash-6.3.2.tar.gz -C /application/
ln -s /application/logstash-6.3.2 /application/logstash

#收集IIS日志为例
cd /application/logstash/
mkdir conf && cd conf
cat IIS.conf
input {
    beats {
        port => "5044"
        codec => json
    }
}

filter {
        if [message] =~ "^#" { drop {} }
        grok {
            match =>{"message" => "%{TIMESTAMP_ISO8601:timestamp} %{IPORHOST:s_ip} %{WORD:request_method} %{NOTSPACE:uripath} %{NOTSPACE:uri-query} %{NUMBER:port} - %{IPORHOST:c_ip} %{NOTSPACE:agent} %{NOTSPACE:referer} %{NUMBER:status} %{NUMBER:sc_bytes} %{NUMBER:cs_bytes} %{NUMBER:time}" }
        }
        date {
            match => ["timestamp","YYYY-MM-dd HH:mm:ss"]
        }
        mutate {
                 remove_field => ["message","beat","_id","host","@version","_score","tags"]
        }
}

output {
    elasticsearch {
        hosts => ["10.10.114.4:9200"]
        index => "logstash-iis-%{+YYYY.MM.dd}"
        }

    stdout {
        codec => rubydebug
        }
}


首先来测试配置文件是否可用,使用-f标志指定配置文件。

/application/logstash/bin/logstash -f conf/IIS.conf --config.test_and_exit

--config.test_and_exit,会测试你配置文件的正确性,并给出错误信息.

如果可用,会输出 OK ,之后可以通过下面的命令来启动logstash

/application/logstash/bin/logstash -f conf/IIS.conf &

查看端口
netstat -ntpl|grep 5044
客户端安装Filebeat
windows下直接解压缩后filebeat-6.3.2-windows-x86_64
修改filebeat.yml文件
filebeat.inputs:

- type: log
  encoding: GBK  #编码格式
  enabled: true

  paths:
    - D:ApplicationLogs*** #收集日志的路径


output.logstash:
  hosts: ["10.10.114.2:5044"] #直接写到logstash
可以在cmd下测试执行、可以查看到传输的日志文件
/路径/filebeat.exe -c filebeat.yml -e
head插件安装
Elasticsearch6.x版本不能使用命令直接安装head插件
修改配置文件/etc/elasticsearch/elasticsearch.yml增加参数
# 增加参数,使head插件可以访问es
http.cors.enabled: true
http.cors.allow-origin: "*"

下载head插件
cd /usr/local/src
wget  https://github.com/mobz/elasticsearch-head/archive/master.zip
unzip master.zip
mv elasticsearch-head-master/ /application/

安装node
wget https://npm.taobao.org/mirrors/node/latest-v4.x/node-v4.4.7-linux-x64.tar.gz
tar -zxvf node-v4.4.7-linux-x64.tar.gz

修改环境变量/etc/profile添加

export NODE_HOME=/application/node-v4.4.7-linux-x64
export PATH=$PATH:$NODE_HOME/bin
export NODE_PATH=$NODE_HOME/lib/node_modules

设置生效
source /etc/profile

安装grunt
cd /application/elasticsearch-head-master
npm install -g grunt-cli

检查是否安装成功
[root@elk elasticsearch]# grunt -version
grunt-cli v1.3.1
修改head插件源码/application/elasticsearch-head-master/Gruntfile.js
hostname是新增的,不要忘记原有的true后面加,符号

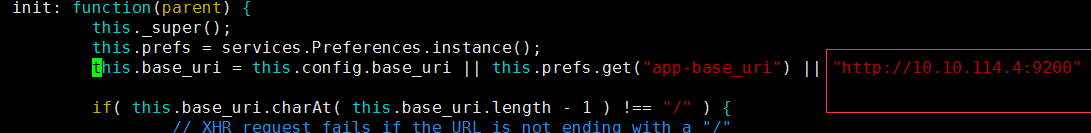
修改连接地址/application/elasticsearch-head-master/_site/app.js
下载运行head必要的文件(放置在文件夹/tmp下)
cd /tmp
wget https://github.com/Medium/phantomjs/releases/download/v2.1.1/phantomjs-2.1.1-linux-x86_64.tar.bz2
yum -y install bzip2
运行head
cd /application/elasticsearch-head-master
npm install
后台启动
grunt server &
web页面验证
可以查看到node1节点

最简单的做法就是直接在谷歌浏览器添加应用程序