项目本身存在大量并发...点击右上角x,不要犹豫直接go重构
如果没有太多的并发,可以考虑通过uwsgi方式提升项目性能,会提升3-5倍
压测工具
mac自带的ab其实就是ApacheBench工具
常用命令
ab -h
Usage: ab [options] [http[s]://]hostname[:port]/path
Options are:
    -n requests     Number of requests to perform
    -c concurrency  Number of multiple requests to make at a time
    -t timelimit    Seconds to max. to spend on benchmarking
                    This implies -n 50000
    -s timeout      Seconds to max. wait for each response
                    Default is 30 seconds
    -b windowsize   Size of TCP send/receive buffer, in bytes
    -B address      Address to bind to when making outgoing connections
    -p postfile     File containing data to POST. Remember also to set -T
    -u putfile      File containing data to PUT. Remember also to set -T
    -T content-type Content-type header to use for POST/PUT data, eg.
                    'application/x-www-form-urlencoded'
                    Default is 'text/plain'
    -v verbosity    How much troubleshooting info to print
    -w              Print out results in HTML tables
    -i              Use HEAD instead of GET
    -x attributes   String to insert as table attributes
    -y attributes   String to insert as tr attributes
    -z attributes   String to insert as td or th attributes
    -C attribute    Add cookie, eg. 'Apache=1234'. (repeatable)
    -H attribute    Add Arbitrary header line, eg. 'Accept-Encoding: gzip'
                    Inserted after all normal header lines. (repeatable)
    -A attribute    Add Basic WWW Authentication, the attributes
                    are a colon separated username and password.
    -P attribute    Add Basic Proxy Authentication, the attributes
                    are a colon separated username and password.
    -X proxy:port   Proxyserver and port number to use
    -V              Print version number and exit
    -k              Use HTTP KeepAlive feature
    -d              Do not show percentiles served table.
    -S              Do not show confidence estimators and warnings.
    -q              Do not show progress when doing more than 150 requests
    -l              Accept variable document length (use this for dynamic pages)
    -g filename     Output collected data to gnuplot format file.
    -e filename     Output CSV file with percentages served
    -r              Don't exit on socket receive errors.
    -m method       Method name
    -h              Display usage information (this message)
    -Z ciphersuite  Specify SSL/TLS cipher suite (See openssl ciphers)
    -f protocol     Specify SSL/TLS protocol
                    (SSL3, TLS1, TLS1.1, TLS1.2 or ALL)
部分解释:
-
-n在测试会话中所执行的请求个数。默认时,仅执行一个请求。
-
-c一次产生的请求个数。默认是一次一个。
-
-t测试所进行的最大秒数。其内部隐含值是-n 50000,它可以使对服务器的测试限制在一个固定的总时间以内。默认时,没有时间限制。
-
-p包含了需要POST的数据的文件。
-
-P对一个中转代理提供BASIC认证信任。用户名和密码由一个:隔开,并以base64编码形式发送。无论服务器是否需要(即, 是否发送了401认证需求代码),此字符串都会被发送。
-
-T POST数据所使用的Content-type头信息。
-
-v设置显示信息的详细程度-4或更大值会显示头信息,3或更大值可以显示响应代码(404,200等),2或更大值可以显示警告和其他信息。
-
-V显示版本号并退出。
-
-w以HTML表的格式输出结果。默认时,它是白色背景的两列宽度的一张表。
-
-i执行HEAD请求,而不是GET。
-
-x设置table属性的字符串。
-
-X对请求使用代理服务器。
-
-y设置tr属性的字符串。
-
-z设置td属性的字符串。
-
-C对请求附加一个Cookie:行。其典型形式是name=value的一个参数对,此参数可以重复。
-
-H对请求附加额外的头信息。此参数的典型形式是一个有效的头信息行,其中包含了以冒号分隔的字段和值的对(如,"Accept-Encoding:zip/zop;8bit")。
-
-A对服务器提供BASIC认证信任。用户名和密码由一个:隔开,并以base64编码形式发送。无论服务器是否需要(即,是否发送了401认证需求代码),此字符串都会被发送。
-
-h显示使用方法。
-
-d不显示"percentage served within XX [ms] table"的消息(为以前的版本提供支持)。
-
-e产生一个以逗号分隔的(CSV)文件,其中包含了处理每个相应百分比的请求所需要(从1%到100%)的相应百分比的(以微妙为单位)时间。由于这种格式已经“二进制化”,所以比'gnuplot'格式更有用。
-
-g把所有测试结果写入一个'gnuplot'或者TSV(以Tab分隔的)文件。此文件可以方便地导入到Gnuplot,IDL,Mathematica,Igor甚至Excel中。其中的第一行为标题。
-
-i执行HEAD请求,而不是GET。
-
-k启用HTTP KeepAlive功能,即在一个HTTP会话中执行多个请求。默认时,不启用KeepAlive功能。
-
-q如果处理的请求数大于150,ab每处理大约10%或者100个请求时,会在stderr输出一个进度计数。此-q标记可以抑制这些信息。
ab -n 100 -c 5 "http://www.baidu.com/"
This is ApacheBench, Version 2.3 <$Revision: 1748469 $>
Copyright 1996 Adam Twiss, Zeus Technology Ltd, http://www.zeustech.net/
Licensed to The Apache Software Foundation, http://www.apache.org/

Benchmarking www.baidu.com (be patient).....done


Server Software:        BWS/1.1
Server Hostname:        www.baidu.com
Server Port:            80

Document Path:          /
Document Length:        102142 bytes

Concurrency Level:      5
Time taken for tests:   1.240 seconds
Complete requests:      100
Failed requests:        96
   (Connect: 0, Receive: 0, Length: 96, Exceptions: 0)
Total transferred:      10305717 bytes
HTML transferred:       10210514 bytes
Requests per second:    80.64 [#/sec] (mean)
Time per request:       62.006 [ms] (mean)
Time per request:       12.401 [ms] (mean, across all concurrent requests)
Transfer rate:          8115.43 [Kbytes/sec] received

Connection Times (ms)
              min  mean[+/-sd] median   max
Connect:        3   20  11.0     21      60
Processing:    14   41  21.5     45      87
Waiting:        4   17  11.5     17      50
Total:         18   61  26.7     69     119

Percentage of the requests served within a certain time (ms)
  50%     69
  66%     76
  75%     79
  80%     84
  90%     95
  95%    102
  98%    107
  99%    119
 100%    119 (longest request)
-
Server Software表示被测试的Web服务器软件名称。
-
Server Hostname表示请求的URL主机名。
-
Server Port表示被测试的Web服务器软件的监听端口。
-
Document Path表示请求的URL中的根绝对路径,通过该文件的后缀名,我们一般可以了解该请求的类型。
-
Document Length表示HTTP响应数据的正文长度。
-
Concurrency Level表示并发用户数,这是我们设置的参数之一。
-
Time taken for tests表示所有这些请求被处理完成所花费的总时间。
-
Complete requests表示总请求数量,这是我们设置的参数之一。
-
Failed requests表示失败的请求数量,这里的失败是指请求在连接服务器、发送数据等环节发生异常,以及无响应后超时的情况。如果接收到的HTTP响应数据的头信息中含有2XX以外的状态码,则会在测试结果中显示另一个名为“Non-2xx responses”的统计项,用于统计这部分请求数,这些请求并不算在失败的请求中。
-
Total transferred表示所有请求的响应数据长度总和,包括每个HTTP响应数据的头信息和正文数据的长度。注意这里不包括HTTP请求数据的长度,仅仅为web服务器流向用户PC的应用层数据总长度。
-
HTML transferred表示所有请求的响应数据中正文数据的总和,也就是减去了Total transferred中HTTP响应数据中的头信息的长度。
-
Requests per second吞吐率,计算公式:Complete requests/Time taken for tests
-
Time per request用户平均请求等待时间,计算公式:Time token for tests/(Complete requests/Concurrency Level)。
-
Time per requet(across all concurrent request)服务器平均请求等待时间,计算公式:Time taken for tests/Complete requests,正好是吞吐率的倒数。也可以这么统计:Time per request/Concurrency Level。
-
Transfer rate表示这些请求在单位时间内从服务器获取的数据长度,计算公式:Total trnasferred/ Time taken for tests,这个统计很好的说明服务器的处理能力达到极限时,其出口宽带的需求量。
-
Percentage of requests served within a certain time(ms)这部分数据用于描述每个请求处理时间的分布情况,比如以上测试,80%的请求处理时间都不超过6ms,这个处理时间是指前面的Time per request,即对于单个用户而言,平均每个请求的处理时间。
测试django项目
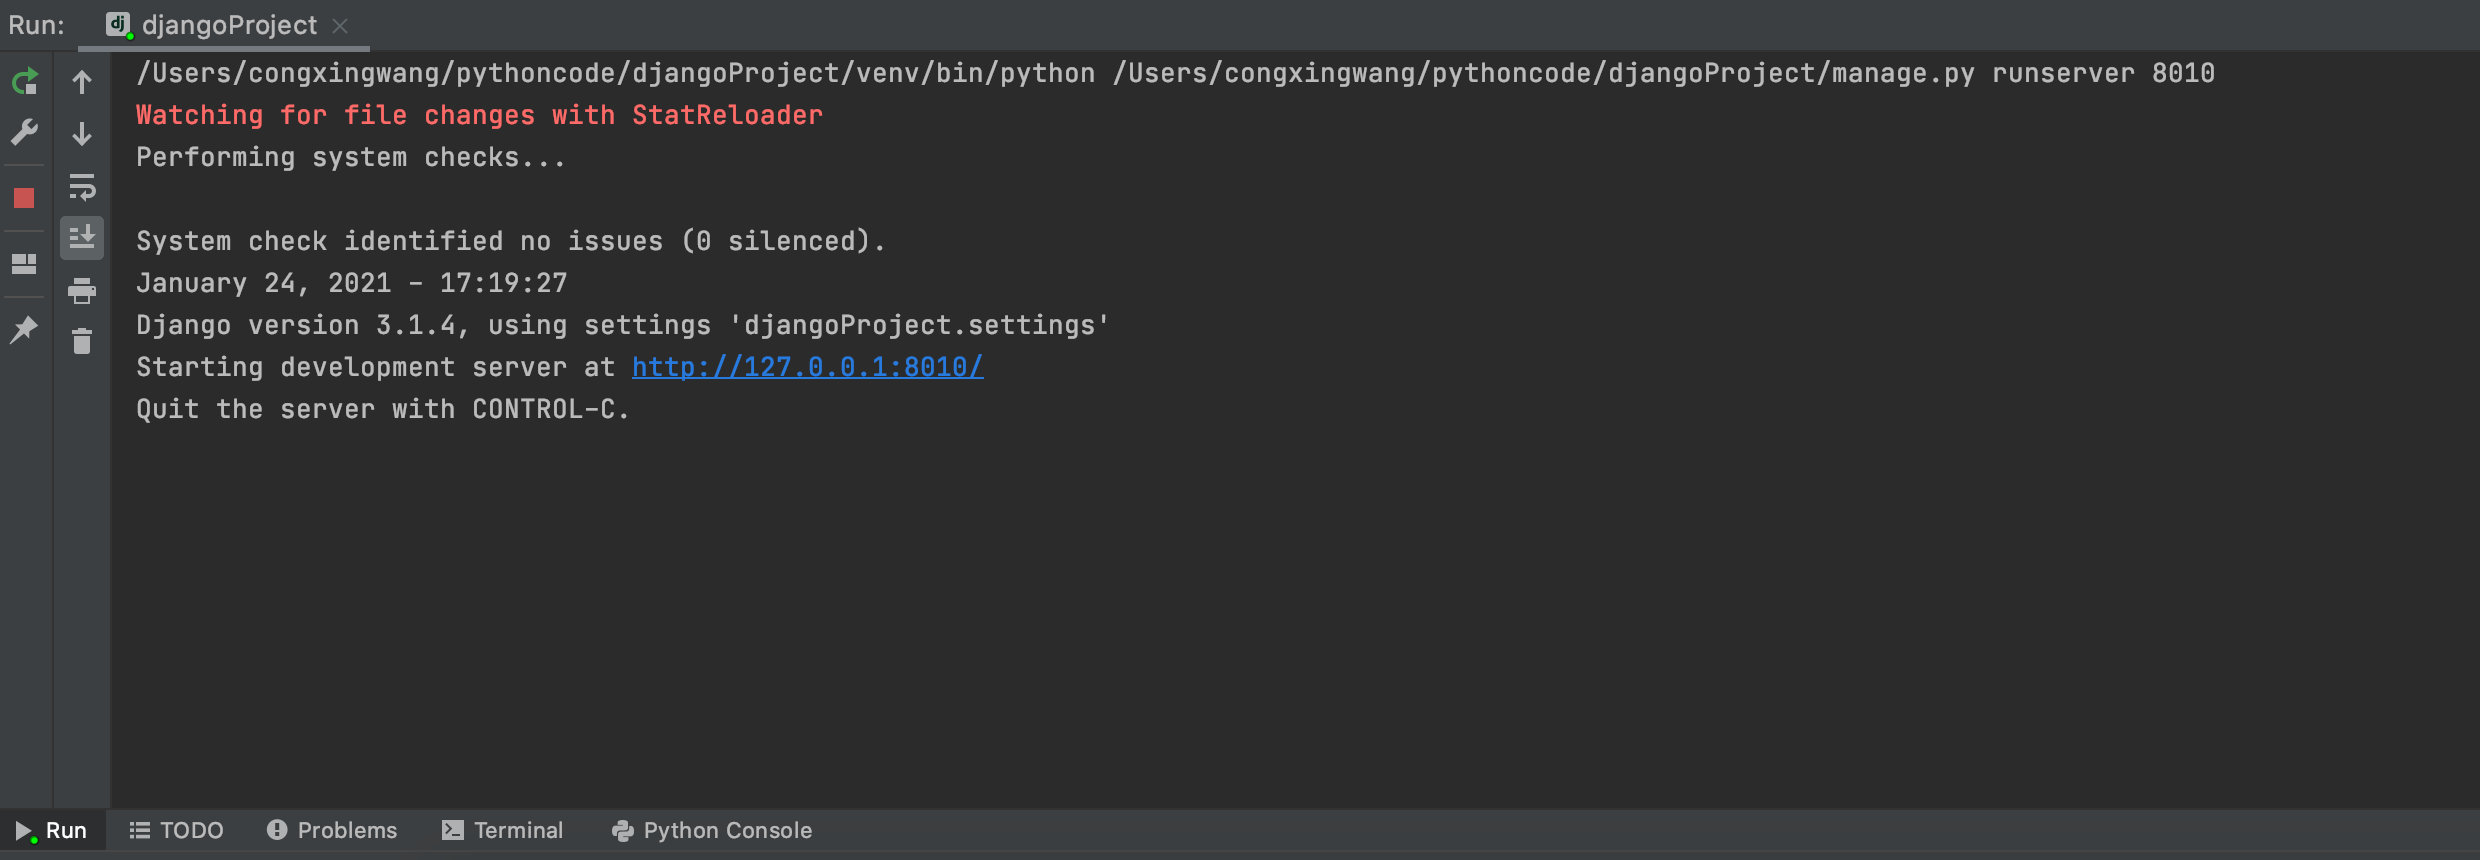
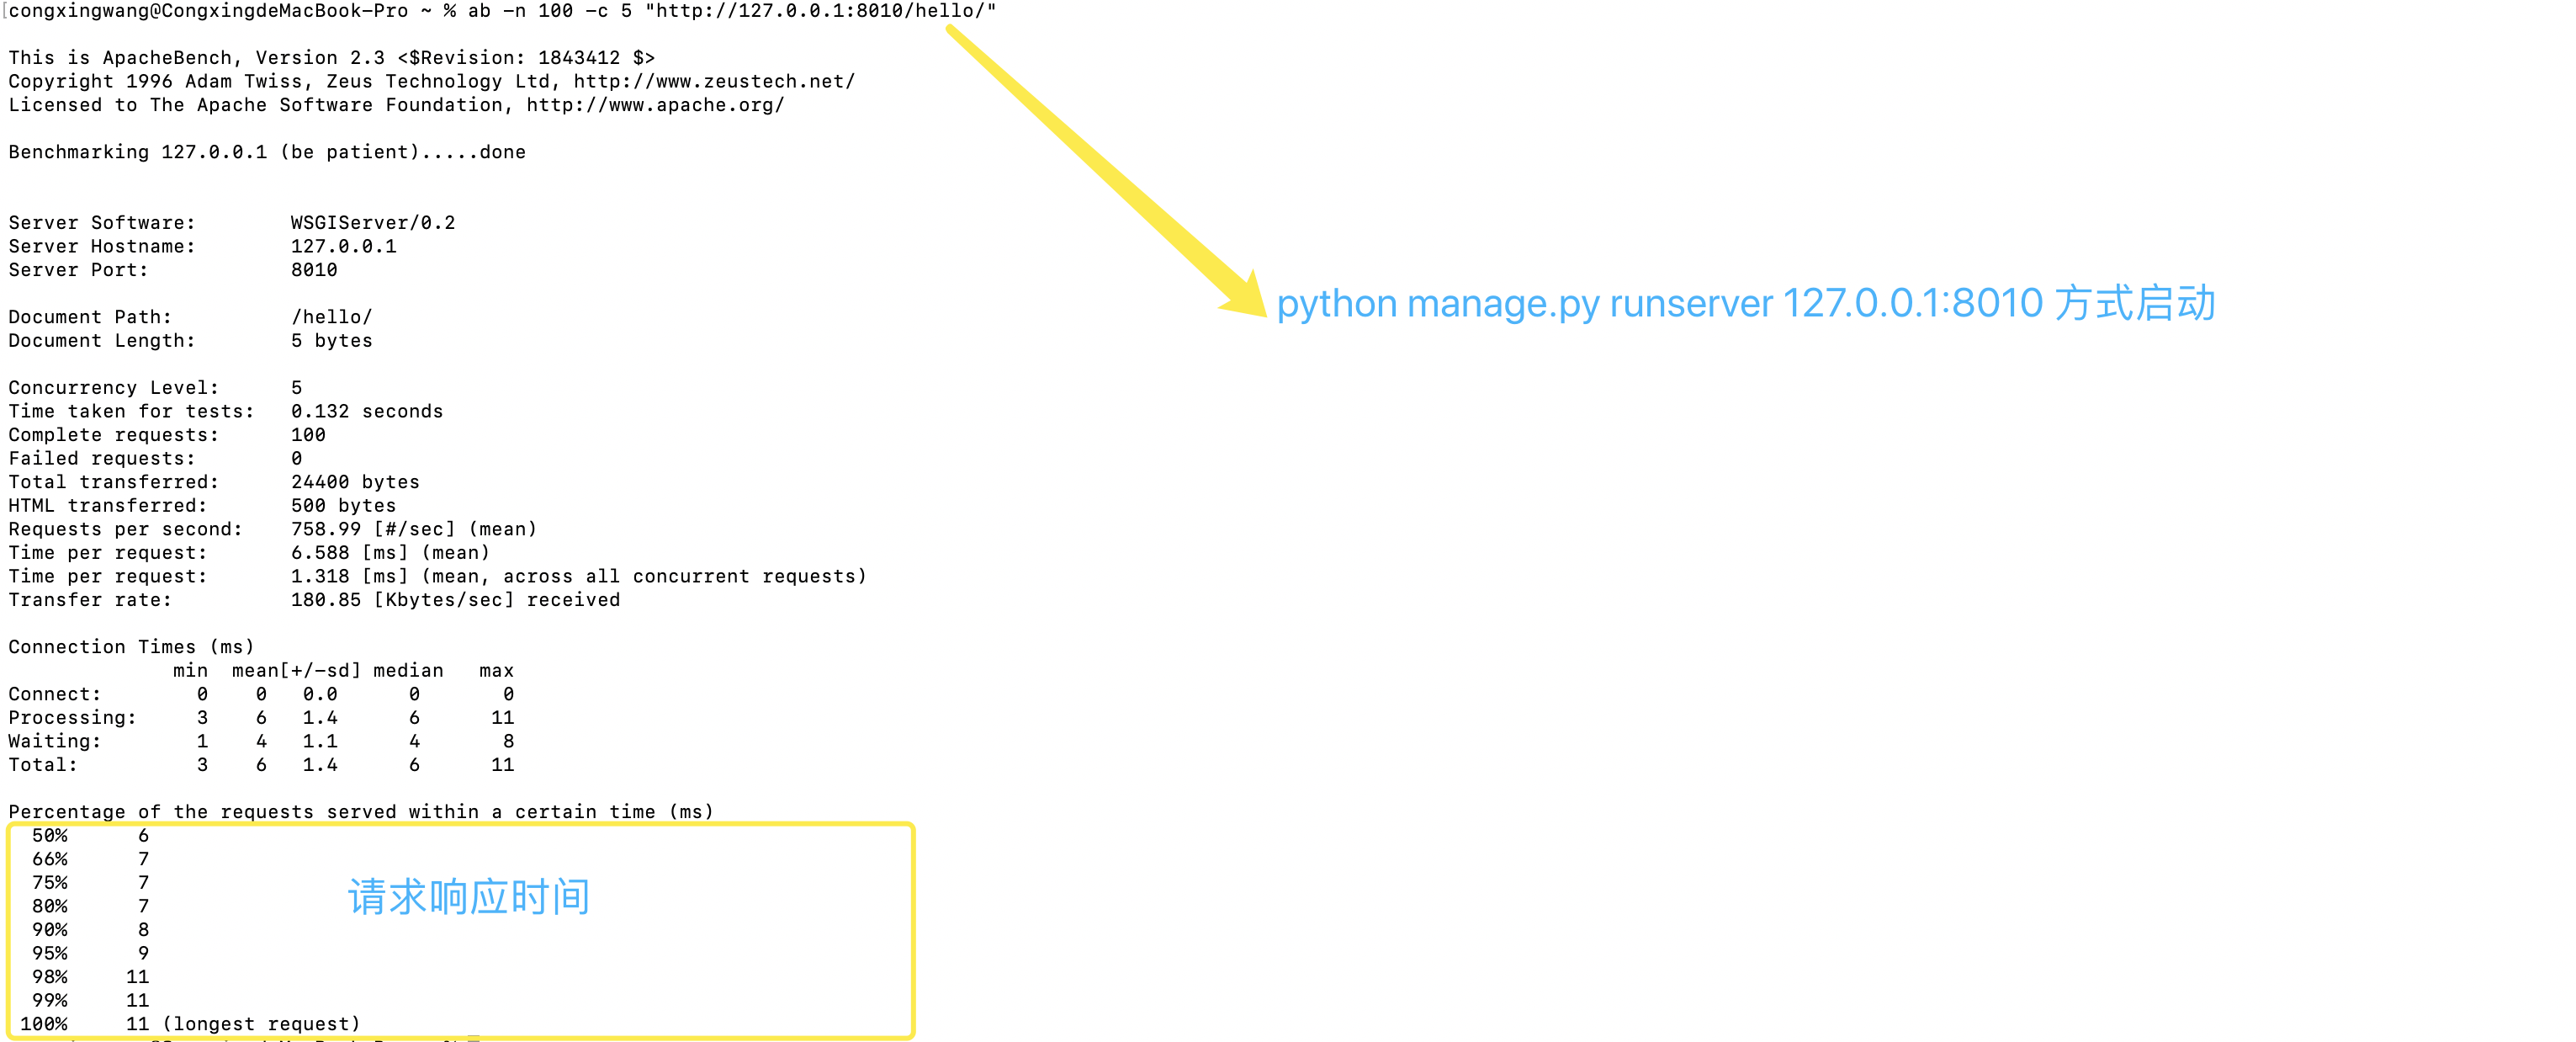
方式一 python manage.py runserver 127.0.0.1:8010
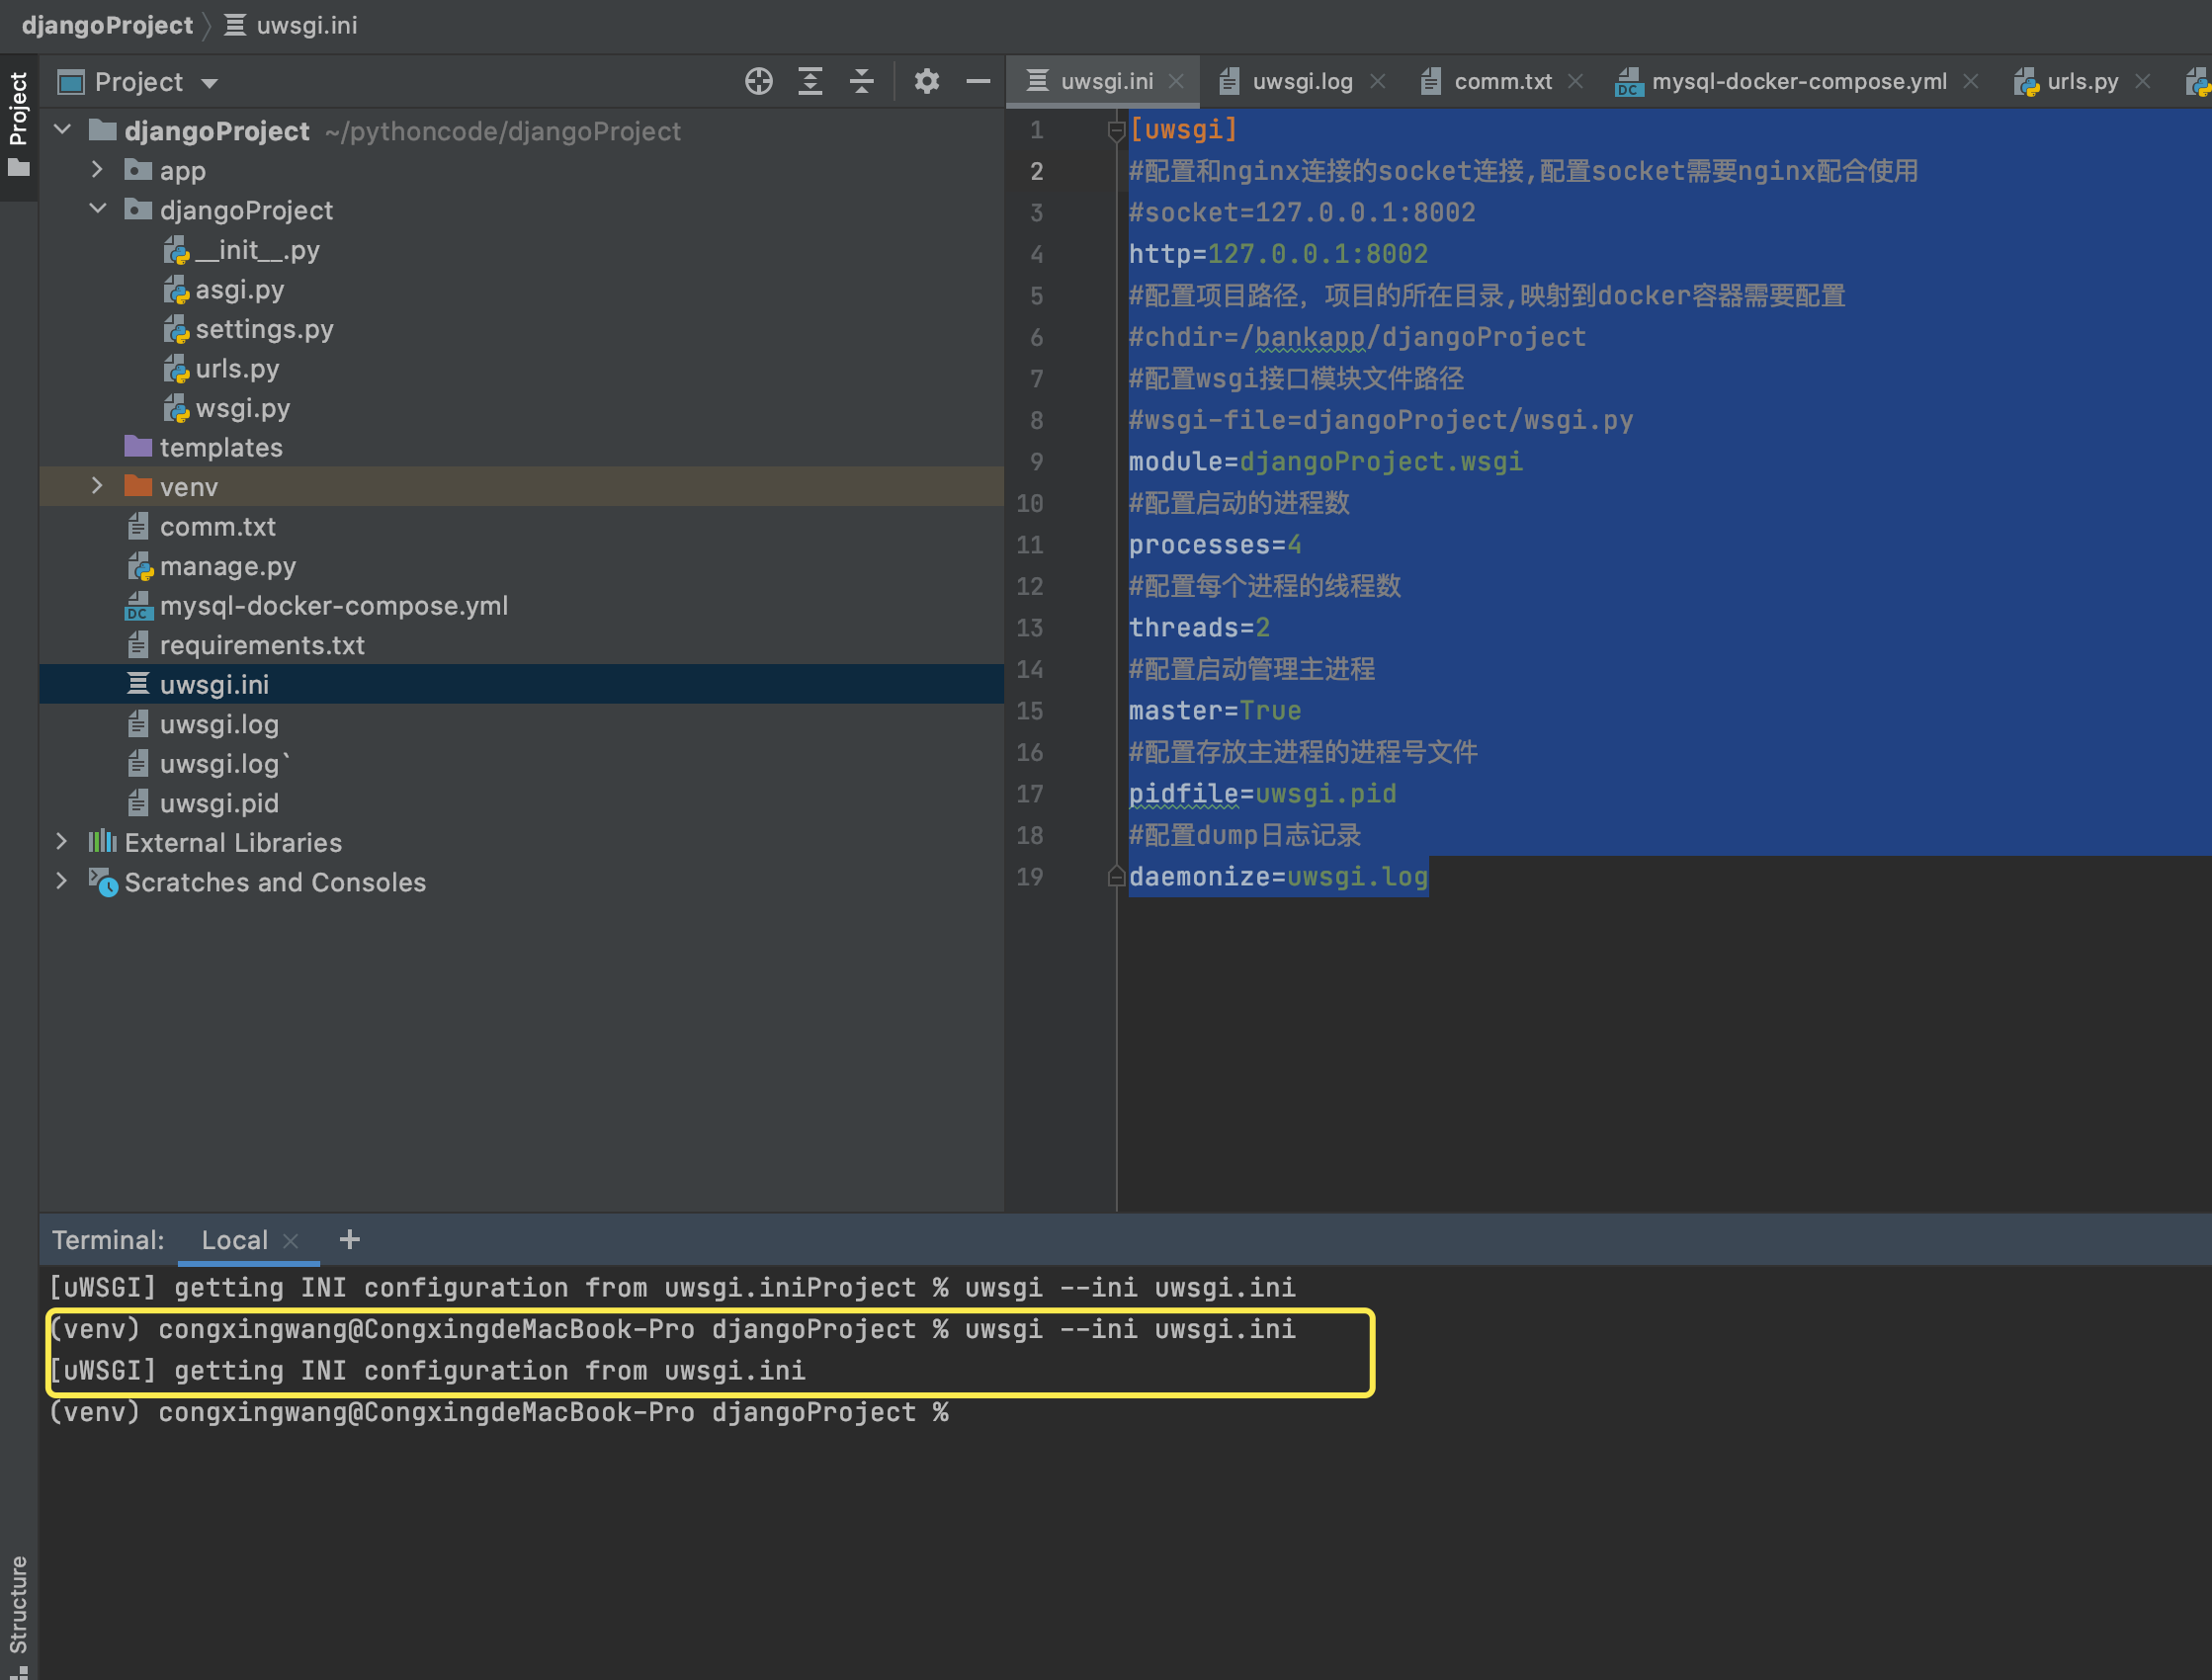
方式二项目根目录新建uwsgi.ini
安装uwsgi
pip install uwsgi
[uwsgi]
#配置和nginx连接的socket连接,配置socket需要nginx配合使用
#socket=127.0.0.1:8002
http=127.0.0.1:8002
#配置项目路径,项目的所在目录,映射到docker容器需要配置
#chdir=/bankapp/djangoProject
#配置wsgi接口模块文件路径
#wsgi-file=djangoProject/wsgi.py
module=djangoProject.wsgi
#配置启动的进程数
processes=4
#配置每个进程的线程数
threads=2
#配置启动管理主进程
master=True
#配置存放主进程的进程号文件
pidfile=uwsgi.pid
#配置dump日志记录
daemonize=uwsgi.log
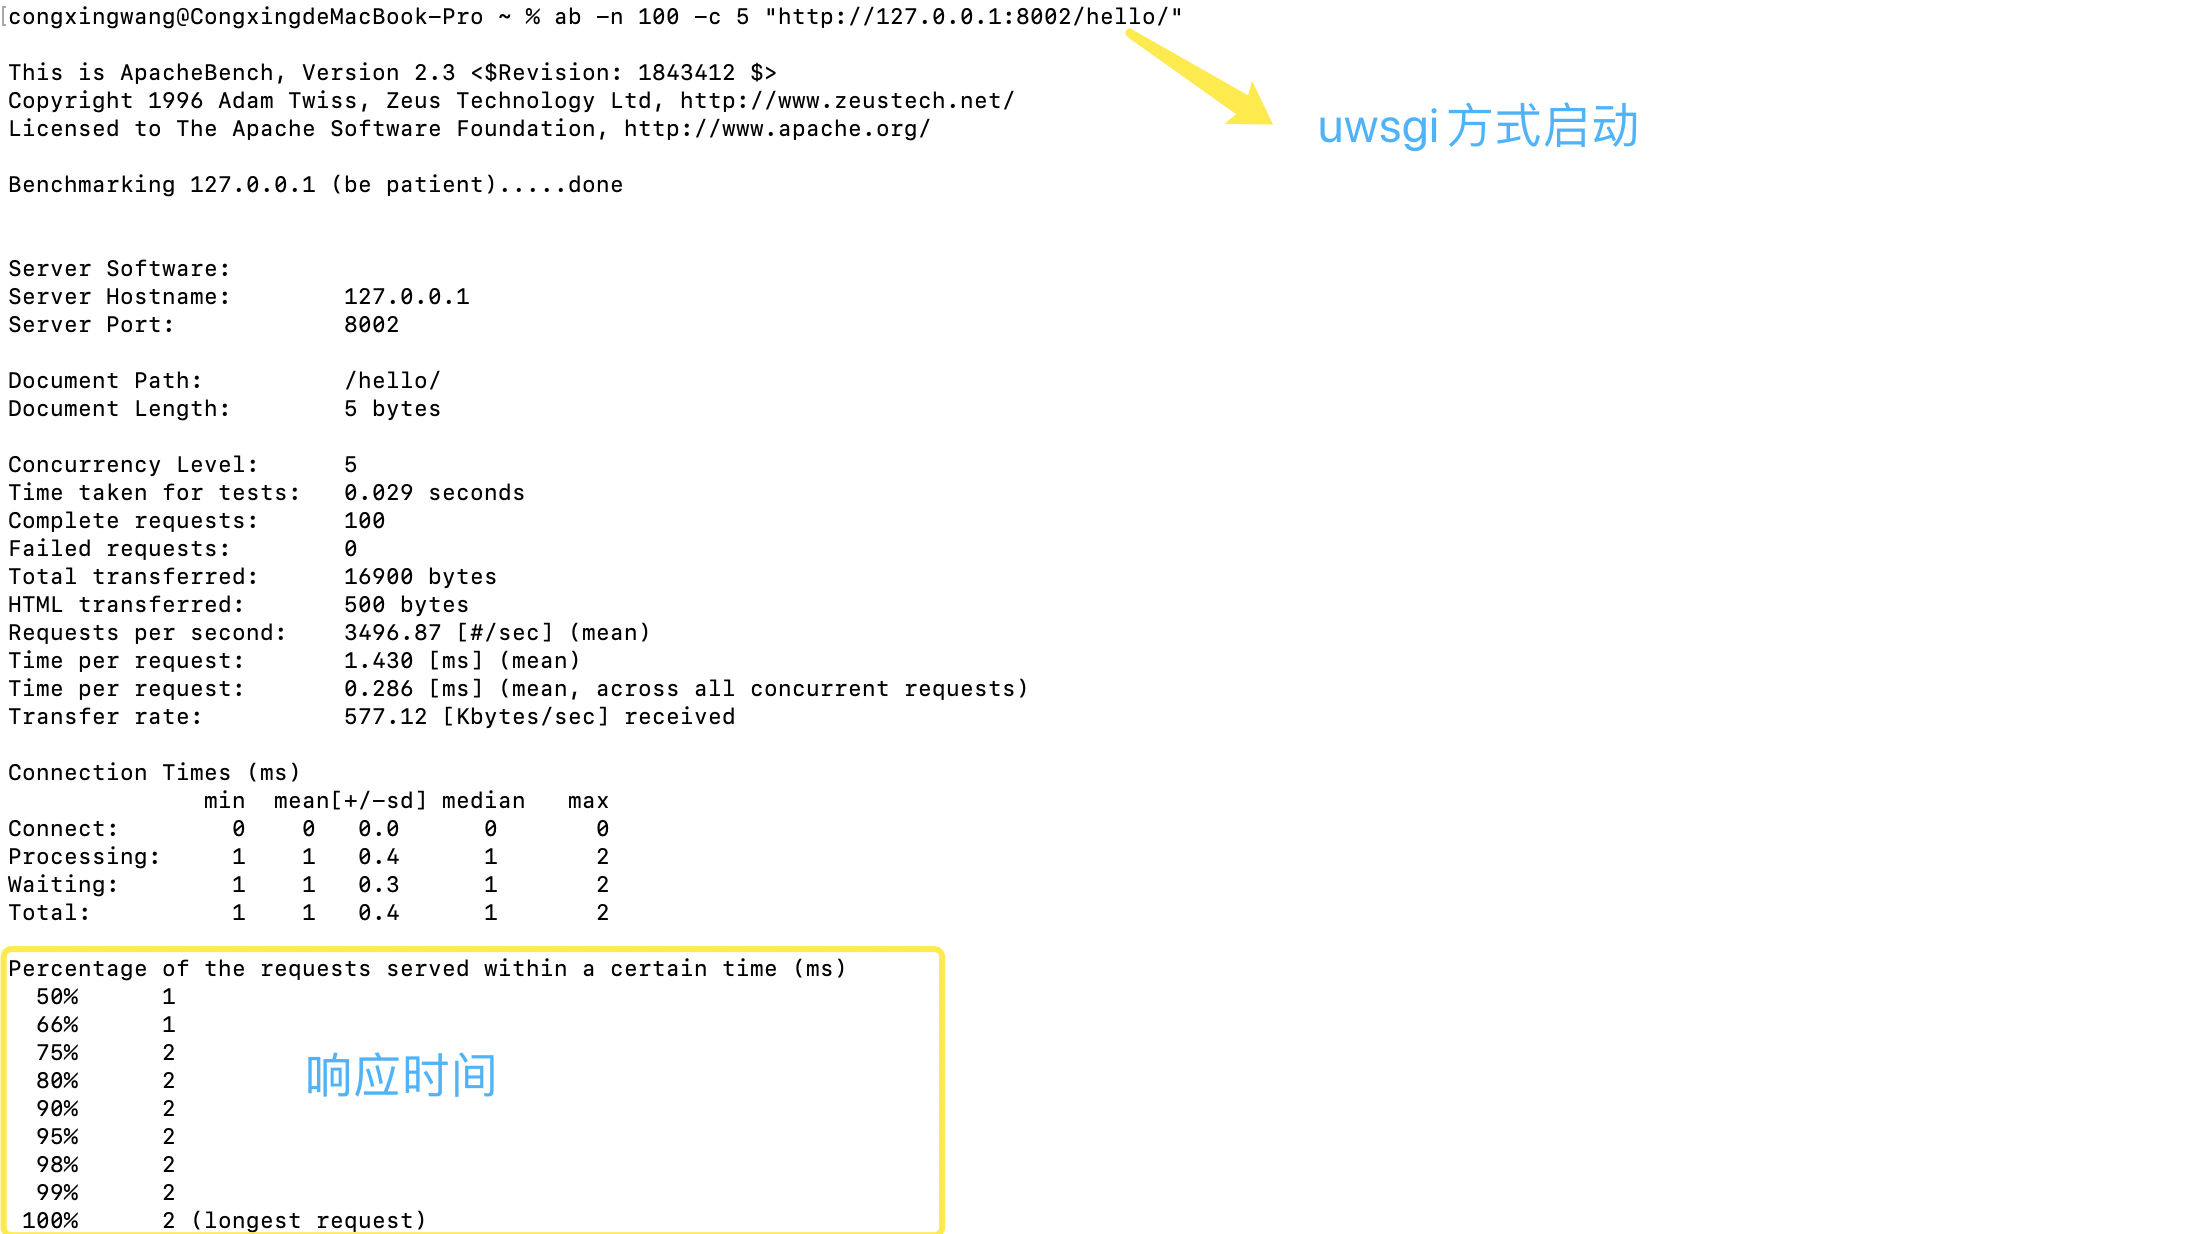
以uwsgi方式启动