最近边看NG老师的机器学习课程和西瓜书,无奈交织着各种数学推导,有些晦涩难懂,看到网上推荐了《machine learning in action》比较适合新手入门,
书中数据和源码在此 http://pan.baidu.com/s/1miIcMPM
书中也有代码实现。便开始混着看。顺便学一下python。这是廖雪峰老师的课程网站 https://www.liaoxuefeng.com/wiki/0014316089557264a6b348958f449949df42a6d3a2e542c000
首先是第二章 k-近邻算法 (k-Nearest Neighbor 土话就是k个最近的邻居)
简单的说,k-近邻算法采用测量不同特征值之间的距离方法进行分类,注:本文参考了https://www.cnblogs.com/xiaoyesoso/p/5208079.html的内容,侵删
主要有5个步骤
(1)计算已知类别数据集中的点与当前点之间的距离
(2)按照距离递增次序排序
(3)选取与当前点距离最小的k个点
(4)确定前k个点所在类别的出现频率
(5)返回前k个点出现频率最高的类别作为当前点的预测分类
示例代码
from numpy import *
import operator


def createDataSet():
    group = array([[1.0, 1.1], [1.0, 1.], [0, 0.], [0, 0.1]])
    labels = ['A', 'A', 'B', 'B']
    return group, labels


def classify0(inX, dataSet, labels, k):
    dataSetSize = dataSet.shape[0]
    #1距离计算
    diffMat = tile(inX, (dataSetSize, 1)) - dataSet
    sqDiffMat = diffMat ** 2
    sqDistances = sqDiffMat.sum(axis=1)
    distances = sqDistances ** 0.5
    sortedDistIndicies = distances.argsort()
    #2选择距离最小的k个点
    classCount = {}
    for i in range(k):
        voteIlabel = labels[sortedDistIndicies[i]]
        classCount[voteIlabel] = classCount.get(voteIlabel, 0) + 1
    #3排序
    sortedClassCount = sorted(classCount.items(), key=operator.itemgetter(1), reverse=True)
    return sortedClassCount[0][0]
注意点:
(1)tile函数说明 代码来源 http://blog.csdn.net/ksearch/article/details/21388985

>>> import numpy
>>> numpy.tile([0,0],5)#在列方向上重复[0,0]5次,默认行1次
array([0, 0, 0, 0, 0, 0, 0, 0, 0, 0])
>>> numpy.tile([0,0],(1,1))#在列方向上重复[0,0]1次,行1次
array([[0, 0]])
>>> numpy.tile([0,0],(2,1))#在列方向上重复[0,0]1次,行2次
array([[0, 0],
       [0, 0]])
>>> numpy.tile([0,0],(3,1))
array([[0, 0],
       [0, 0],
       [0, 0]])
>>> numpy.tile([0,0],(1,3))#在列方向上重复[0,0]3次,行1次
array([[0, 0, 0, 0, 0, 0]])
>>> numpy.tile([0,0],(2,3))<span style="font-family: Arial, Helvetica, sans-serif;">#在列方向上重复[0,0]3次,行2次</span>
array([[0, 0, 0, 0, 0, 0],
       [0, 0, 0, 0, 0, 0]])
简单说就是tile([a,b],(x,y)) 把矩阵[a,b]在行方向重复x次,在列方向重复y次
(2)sum函数说明 代码来源 http://blog.csdn.net/ikerpeng/article/details/17026011
1.python的sum

>>> sum([0,1,2])
3
>>> sum([0,1,2],3)
6
>>> sum([0,1,2],[3,2,1])
Traceback (most recent call last):
  File "<stdin>", line 1, in <module>
TypeError: can only concatenate list (not "int") to list
2.numpy的sum

>>> import numpy as np
>>> a=np.sum([[0,1,2],[2,1,3]])
>>> a
9
>>> a.shape
()
>>> a=np.sum([[0,1,2],[2,1,3]],axis=0)
>>> a
array([2, 2, 5])
>>> a.shape
(3,)
>>> a=np.sum([[0,1,2],[2,1,3]],axis=1)
>>> a
array([3, 6])
>>> a.shape
(2,)
所以上面的axis=1就是按行相加
函数的前五行即算出了输出点和样本集的欧氏距离
(3)argsort函数说明 好吧,我又要引用了,来源 https://www.zhihu.com/question/24029886/answer/26444149
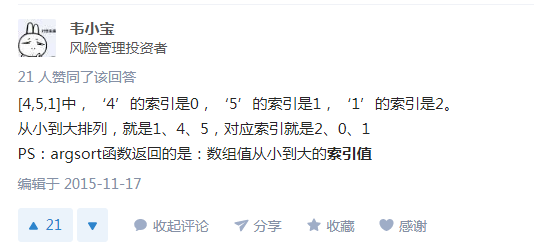
所以 就能选择到前k个距离最近的点。我比较笨。。想了一会儿才明白
(4)sorted函数 继续引用..
来源 https://www.cnblogs.com/xiaoyesoso/p/5208079.html
https://www.cnblogs.com/sysu-blackbear/p/3283993.html

这里我第一个参数用的是classCount.items()。而书上用的是classCount.iteritems()。因为前者py3后者py2。所以上面的代码只要改这个地方就可以在2下运行。
详情见 http://www.runoob.com/python/att-dictionary-items.html Python 字典(Dictionary) items() 函数以列表返回可遍历的(键, 值) 元组数组。
所以上面最后是将字典分解为元组列表,然后按照第二个元素的次序对元组进行逆序排序,最后返回发生频率最高的元素标签。
测试一下

然而这并没有什么卵用,下面继续。
Demo:使用kNN算法改进约会网站的配对效果
(1)准备数据:从文本文件中解析数据
文本文件下载地址 https://pan.baidu.com/s/1o8BSXWu
def file2matrix(filename):
    fr = open(filename)
    arrayOLines = fr.readlines()
    #得到文件行数
    numberOfLines = len(arrayOLines)
    #创建以0填充的矩阵
    returnMat = zeros((numberOfLines, 3))
    classLabelVector = []
    index = 0
    for line in arrayOLines:
        #截取掉所有回车字符
        line = line.strip()
        #将整行数据分割成一个元素列表
        listFromLine = line.split('	')
        returnMat[index, :] = listFromLine[0:3]
        classLabelVector.append(int(listFromLine[-1]))
        index += 1
    return returnMat, classLabelVector
测试一下
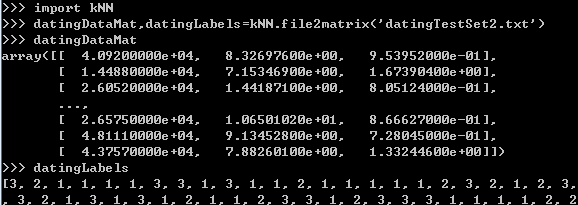
(2)分析数据:使用Matplotlib创建散点图(在命令行中或main函数)
    import matplotlib
    import matplotlib.pyplot as plt

    fig = plt.figure()  # figure创建一个绘图对象
    ax = fig.add_subplot(111)  # 若参数为349,意思是:将画布分割成3行4列,图像画在从左到右从上到下的第9块,
    datingDataMat, datingLabels = file2matrix('datingTestSet2.txt')
    ax.scatter(datingDataMat[:, 1], datingDataMat[:, 2])
    plt.show()
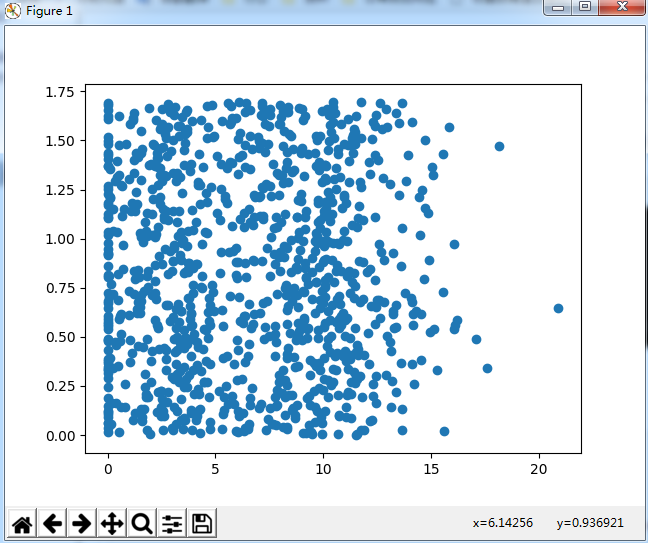
散点图使用datingDataMat矩阵的第二、三列数据,分别表示特征值“玩视频游戏所耗时间百分比”和“每周所消耗的冰淇淋公升数”。
可以用色彩或者其他的几号来标记不同样本分类,以便更好的理解数据信息。
改进如下
    import matplotlib
    import matplotlib.pyplot as plt

    fig = plt.figure()  # figure创建一个绘图对象
    ax = fig.add_subplot(111)  # 若参数为349,意思是:将画布分割成3行4列,图像画在从左到右从上到下的第9块,
    datingDataMat, datingLabels = file2matrix('datingTestSet2.txt')
    '''
    matplotlib.pyplot.scatter(x, y, s=20, c='b', marker='o', cmap=None,
    norm=None, vmin=None, vmax=None, alpha=None, linewidths=None, verts=None, hold=None,**kwargs)
    其中,xy是点的坐标,s是点的大小
    maker是形状可以maker=(5,1)5表示形状是5边型,1表示是星型(0表示多边形,2放射型,3圆形)
    alpha表示透明度;facecolor=‘none’表示不填充。
    '''
    # ax.scatter(datingDataMat[:, 1], datingDataMat[:, 2])
    # 设置字体防止中文乱码
    zhfont = matplotlib.font_manager.FontProperties(fname='C:WindowsFontsSTXINGKA.TTF')
    plt.xlabel('玩视频游戏所耗时间百分比', fontproperties=zhfont)
    plt.ylabel('每周消费的冰淇淋公升数', fontproperties=zhfont)
    ax.scatter(datingDataMat[:, 1], datingDataMat[:, 2],
               15.0 * array(datingLabels), 15.0 * array(datingLabels))
    plt.show()
其中设置字体的说明可以参照 https://www.cnblogs.com/nolonely/p/6944150.html 和 http://blog.csdn.net/u012705410/article/details/47379957
scatter函数使用说明可以参照 https://www.cnblogs.com/shanlizi/p/6850318.html
效果图
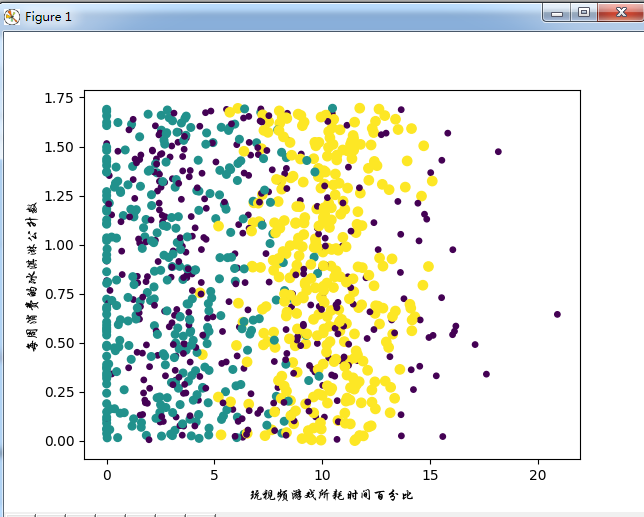
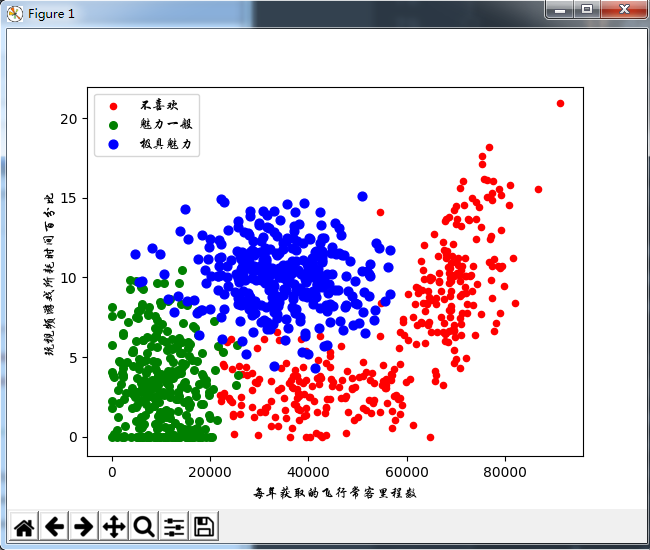
基本上可以看到数据点所属三个样本分类的区域轮廓,但是用矩阵的第一第二列属性可以得到更好的展示效果。
emmmm。。。这里画图例又参照了
https://www.zhihu.com/question/37146648
https://www.zhihu.com/question/37146648/answer/80425957
def draw():
    fig = plt.figure()  # figure创建一个绘图对象
    ax = fig.add_subplot(111)  # 若参数为349,意思是:将画布分割成3行4列,图像画在从左到右从上到下的第9块,
    datingDataMat, datingLabels = file2matrix('datingTestSet2.txt')

    type1_x = []
    type1_y = []
    type2_x = []
    type2_y = []
    type3_x = []
    type3_y = []
    for i in range(len(datingLabels)):
        if datingLabels[i] == 1:  # 不喜欢
            type1_x.append(datingDataMat[i][0])
            type1_y.append(datingDataMat[i][1])

        if datingLabels[i] == 2:  # 魅力一般
            type2_x.append(datingDataMat[i][0])
            type2_y.append(datingDataMat[i][1])

        if datingLabels[i] == 3:  # 极具魅力
            type3_x.append(datingDataMat[i][0])
            type3_y.append(datingDataMat[i][1])

    type1 = ax.scatter(type1_x, type1_y, s=20, c='red')
    type2 = ax.scatter(type2_x, type2_y, s=30, c='green')
    type3 = ax.scatter(type3_x, type3_y, s=40, c='blue')

    # 设置字体防止中文乱码
    zhfont = matplotlib.font_manager.FontProperties(fname='C:WindowsFontsSTXINGKA.TTF')
    plt.xlabel('每年获取的飞行常客里程数', fontproperties=zhfont)
    plt.ylabel('玩视频游戏所耗时间百分比', fontproperties=zhfont)
    ax.legend((type1, type2, type3), (u'不喜欢', u'魅力一般', u'极具魅力'), loc=2, prop=zhfont)
    plt.show()
(3)准备数据:归一化数值
写了这么长,然而我们的重点刚要开始...真是一篇又臭又长各种引用的博客
我们发现,欧式距离方程中,数字差值最大的属性对计算结果的影响最大,即每年获取的飞行常客里程数对于计算结果的影响将远远大于其他两个特征。
然而这仅仅是因为此特征值远大于其他特征值,不应该如此严重的影响到计算结果。(这里假设三个特征同等重要)
在处理不同取值范围的特征值时,采用数值归一化,如将取值范围处理为0-到1或-1到1。
下面的公式可以将任意取值范围的特征值转化为0到1区间内的值:
newValue=(oldValue-min)/(max-min)
实现函数如下
# newValue=(oldValue-min)/(max-min)
def autoNorm(dataSet):
    # 参数0使得函数可以从列中选取最小值
    minVals = dataSet.min(0)
    maxVals = dataSet.max(0)
    ranges = maxVals - minVals
    normDataSet = zeros(shape(dataSet))
    m = dataSet.shape[0]
    normDataSet = dataSet - tile(minVals, (m, 1))
    normDataSet = normDataSet / tile(ranges, (m, 1))
    return normDataSet, ranges, minVals
(4)测试算法:作为完整程序验证分类器
def datingClassTest():
    #测试数据所占的比例
    hoRatio = 0.1
    datingDataMat, datingLabels = file2matrix('datingTestSet2.txt')
    normMat, ranges, minVals = autoNorm(datingDataMat)
    # 矩阵第一维大小
    m = normMat.shape[0]
    # 测试向量的数量
    numTestVecs = int(m * hoRatio)
    errorCount = 0.0
    for i in range(numTestVecs):
        classifierResult = classify0(normMat[i, :], normMat[numTestVecs:m, :], datingLabels[numTestVecs:m], 3)
        print("the classifier came back with: %d,the real answer is: %d" % (classifierResult, datingLabels[i]))
        if classifierResult != datingLabels[i]:
            errorCount += 1.0
    print("the total error rate is: %f" % (errorCount / float(numTestVecs)))
测试结果

(5)使用算法:构建完整可用系统
def classifyPerson():
    resultList = ['not at all', 'in small doses', 'in large doses']
    percentTats = float(input("percentage of time spent playing video games?"))
    ffMiles = float(input("frequent flier miles earned per year?"))
    iceCream = float(input("liters of ice cream consumed per year?"))
    datingDataMat, datingLabels = file2matrix('datingTestSet2.txt')
    normMat, ranges, minVals = autoNorm(datingDataMat)
    inArr = array([ffMiles, percentTats, iceCream])
    classifierResult = classify0(inArr, datingDataMat, datingLabels, 3)
    print("You will probably like this person: ", resultList[classifierResult - 1])
注:python3中 raw_input() 变成了 input()
emmmmmm....运行结果如下

完整代码如下
#!usr/bin/env python3
# -*-coding:utf-8 -*-

from numpy import *
import operator
import matplotlib
import matplotlib.pyplot as plt


def createDataSet():
    group = array([[1.0, 1.1], [1.0, 1.], [0, 0.], [0, 0.1]])
    labels = ['A', 'A', 'B', 'B']
    return group, labels


def classify0(inX, dataSet, labels, k):
    dataSetSize = dataSet.shape[0]
    # 1距离计算
    diffMat = tile(inX, (dataSetSize, 1)) - dataSet
    sqDiffMat = diffMat ** 2
    sqDistances = sqDiffMat.sum(axis=1)
    distances = sqDistances ** 0.5
    sortedDistIndicies = distances.argsort()
    # 2选择距离最小的k个点
    classCount = {}
    for i in range(k):
        voteIlabel = labels[sortedDistIndicies[i]]
        classCount[voteIlabel] = classCount.get(voteIlabel, 0) + 1
    # 3排序
    sortedClassCount = sorted(classCount.items(), key=operator.itemgetter(1), reverse=True)
    return sortedClassCount[0][0]


def file2matrix(filename):
    fr = open(filename)
    arrayOLines = fr.readlines()
    # 得到文件行数
    numberOfLines = len(arrayOLines)
    # 创建以0填充的矩阵
    returnMat = zeros((numberOfLines, 3))
    classLabelVector = []
    index = 0
    for line in arrayOLines:
        # 截取掉所有回车字符
        line = line.strip()
        # 将整行数据分割成一个元素列表
        listFromLine = line.split('	')
        returnMat[index, :] = listFromLine[0:3]
        classLabelVector.append(int(listFromLine[-1]))
        index += 1
    return returnMat, classLabelVector


# newValue=(oldValue-min)/(max-min)
def autoNorm(dataSet):
    # 参数0使得函数可以从列中选取最小值
    minVals = dataSet.min(0)
    maxVals = dataSet.max(0)
    ranges = maxVals - minVals
    normDataSet = zeros(shape(dataSet))
    m = dataSet.shape[0]
    normDataSet = dataSet - tile(minVals, (m, 1))
    normDataSet = normDataSet / tile(ranges, (m, 1))
    return normDataSet, ranges, minVals


def datingClassTest():
    # 测试数据所占的比例
    hoRatio = 0.1
    datingDataMat, datingLabels = file2matrix('datingTestSet2.txt')
    normMat, ranges, minVals = autoNorm(datingDataMat)
    # 矩阵第一维大小
    m = normMat.shape[0]
    # 测试向量的数量
    numTestVecs = int(m * hoRatio)
    errorCount = 0.0
    for i in range(numTestVecs):
        classifierResult = classify0(normMat[i, :], normMat[numTestVecs:m, :], datingLabels[numTestVecs:m], 3)
        print("the classifier came back with: %d,the real answer is: %d" % (classifierResult, datingLabels[i]))
        if classifierResult != datingLabels[i]:
            errorCount += 1.0
    print("the total error rate is: %f" % (errorCount / float(numTestVecs)))


def classifyPerson():
    resultList = ['not at all', 'in small doses', 'in large doses']
    percentTats = float(input("percentage of time spent playing video games?"))
    ffMiles = float(input("frequent flier miles earned per year?"))
    iceCream = float(input("liters of ice cream consumed per year?"))
    datingDataMat, datingLabels = file2matrix('datingTestSet2.txt')
    normMat, ranges, minVals = autoNorm(datingDataMat)
    inArr = array([ffMiles, percentTats, iceCream])
    classifierResult = classify0(inArr, datingDataMat, datingLabels, 3)
    print("You will probably like this person: ", resultList[classifierResult - 1])


def draw():
    fig = plt.figure()  # figure创建一个绘图对象
    ax = fig.add_subplot(111)  # 若参数为349,意思是:将画布分割成3行4列,图像画在从左到右从上到下的第9块,
    datingDataMat, datingLabels = file2matrix('datingTestSet2.txt')

    '''
    matplotlib.pyplot.scatter(x, y, s=20, c='b', marker='o', cmap=None,
    norm=None, vmin=None, vmax=None, alpha=None, linewidths=None, verts=None, hold=None,**kwargs)
    其中,xy是点的坐标,s是点的大小
    maker是形状可以maker=(5,1)5表示形状是5边型,1表示是星型(0表示多边形,2放射型,3圆形)
    alpha表示透明度;facecolor=‘none’表示不填充。
    '''

    type1_x = []
    type1_y = []
    type2_x = []
    type2_y = []
    type3_x = []
    type3_y = []
    for i in range(len(datingLabels)):
        if datingLabels[i] == 1:  # 不喜欢
            type1_x.append(datingDataMat[i][0])
            type1_y.append(datingDataMat[i][1])

        if datingLabels[i] == 2:  # 魅力一般
            type2_x.append(datingDataMat[i][0])
            type2_y.append(datingDataMat[i][1])

        if datingLabels[i] == 3:  # 极具魅力
            type3_x.append(datingDataMat[i][0])
            type3_y.append(datingDataMat[i][1])

    type1 = ax.scatter(type1_x, type1_y, s=20, c='red')
    type2 = ax.scatter(type2_x, type2_y, s=30, c='green')
    type3 = ax.scatter(type3_x, type3_y, s=40, c='blue')

    # ax.scatter(datingDataMat[:, 1], datingDataMat[:, 2])
    # 设置字体防止中文乱码
    zhfont = matplotlib.font_manager.FontProperties(fname='C:WindowsFontsSTXINGKA.TTF')
    plt.xlabel('每年获取的飞行常客里程数', fontproperties=zhfont)
    plt.ylabel('玩视频游戏所耗时间百分比', fontproperties=zhfont)
    # ax.scatter(datingDataMat[:, 0], datingDataMat[:, 1],
    # 15.0 * array(datingLabels), 15.0 * array(datingLabels))
    ax.legend((type1, type2, type3), (u'不喜欢', u'魅力一般', u'极具魅力'), loc=2, prop=zhfont)
    plt.show()


if __name__ == "__main__":
    classifyPerson()
