生成hprof文件①,top出异常进程②,生成异常进程的dump文件jmap -dump:format=b,file=[文件名] [进程]jmap -dump:format=b,file=heap.hprof 2576③,使用JProfiler分析hprof 文件
使用JProfiler分析大对象
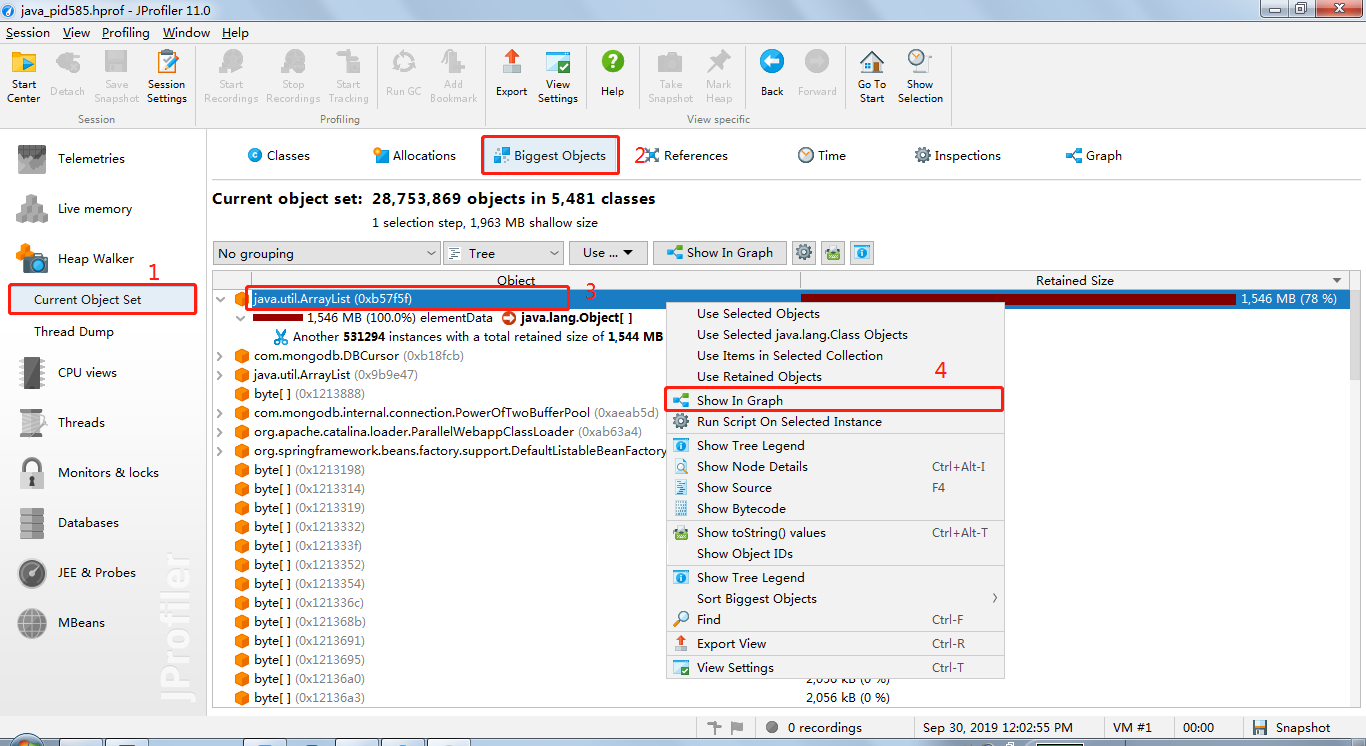
①,导入:session->open snapshot
②,查看大对象:Heap Walker -> Current Object Set ->Giggest Object