https://study.163.com/provider/400000000398149/index.htm?share=2&shareId=400000000398149( 欢迎关注博主主页,学习python视频资源,还有大量免费python经典文章)

Before we tackle how to handle them, let’s quickly define what an outlier is. An outlier is any data point that is distinctly different from the rest of your data points. When you’re looking at a variable that is relatively normally distributed, you can think of outliers as anything that falls 3 or more standard deviations from its mean. While this will suffice as a working definition, keep in mind that there’s no golden rule for defining what an outlier is.
在讨论如何处理它们之前,让我们快速定义什么是异常值。离群值是与其余数据点明显不同的任何数据点。当您查看一个相对正态分布的变量时,您可以将离群值视为与其均值相差3个或更多标准差的任何东西。尽管这可以作为一个可行的定义,但请记住,定义异常值是没有黄金法则的。
In general, outliers belong to one of two categories: a mistake in the data or a true outlier. The first type, a mistake in the data, could be as simple as typing 10000 rather than 100.00 – resulting in a big shift as we’re analyzing the data later on. The second type, a true outlier, would be something like finding Bill Gates in your dataset. His profile probably looks so different from the other people in your list that including him might skew your results. It’s important to distinguish these types because we’ll handle them differently in an analysis. It’s subjective. It’s up to you as the analyst to determine which data points are outliers in any given dataset.
通常,离群值属于以下两类之一:数据错误或真实的离群值。第一种是数据中的错误,可能很简单,就像输入10000而不是100.00一样-导致我们以后分析数据时发生了很大的变化。第二种是真正的异常值,类似于在数据集中找到比尔·盖茨。他的个人资料看起来可能与您列表中的其他人有很大不同,以至于包括他在内的个人资料可能会使您的结果产生偏差。区分这些类型非常重要,因为我们在分析中将以不同的方式处理它们。这是主观的。由您决定作为分析师来确定哪些数据点在任何给定的数据集中是异常值。
Now, how do we deal with outliers? Here are four approaches:
现在,我们如何处理异常值?这是四种方法:
1. Drop the outlier records.
In the case of Bill Gates, or another true outlier, sometimes it’s best to completely remove that record from your dataset to keep that person or event from skewing your analysis.
2. Cap your outliers data.
Another way to handle true outliers is to cap them. For example, if you’re using income, you might find that people above a certain income level behave in the same way as those with a lower income. In this case, you can cap the income value at a level that keeps that intact.
3. Assign a new value.
If an outlier seems to be due to a mistake in your data, you try imputing a value. Common imputation methods include using the mean of a variable or utilizing a regression model to predict the missing value.
4. Try a transformation.
A different approach to true outliers could be to try creating a transformation of the data rather than using the data itself. For example, try creating a percentile version of your original field and working with that new field instead.
Just how much an outlier affects your analysis depends, not surprisingly, on a few factors. One factor is dataset size. In a large dataset, each individual point carries less weight, so an outlier is less worrisome than the same data point would be in a smaller dataset. Another consideration is “how much” of an outlier a point might be – just how far out of line with the rest of your dataset a single point is. A point that is ten times as large as your upper boundary will do more damage than a point that is twice as large.
These are a few ways that we’ve found to help with outliers, but there are certainly others. I’d love to know – what has your experience been with outliers? Do you use any of the above methods?
-Caitlin Garrett, Statistical Analyst
1.删除异常值记录。
对于Bill Gates或其他真正的异常值,有时最好将其从数据集中完全删除,以免该人或事件歪曲您的分析。
2.限制您的异常数据。
处理真实异常值的另一种方法是对它们进行上限。例如,如果您使用收入,则可能会发现某个收入水平以上的人的行为与收入较低的人的行为相同。在这种情况下,您可以将收入值的上限保持不变。
3.分配一个新值。
如果异常值似乎是由于数据错误引起的,请尝试估算一个值。常见的插补方法包括使用变量的平均值或使用回归模型来预测缺失值。
4.尝试转换。
解决真实异常值的另一种方法是尝试创建数据的转换,而不是使用数据本身。例如,尝试创建原始字段的百分位数版本,然后使用该新字段。
异常值对您的分析的影响取决于几个因素,这并不奇怪。一个因素是数据集大小。在大型数据集中,每个单独的点都具有较小的权重,因此与较小数据集中的相同数据点相比,离群值更不会令人担忧。另一个考虑因素是一个点可能有“多少” –一个点与数据集的其余部分不一致。比上边界大十倍的点将造成更大的损害。
这些是我们发现的可以帮助解决异常值的方法,但是当然还有其他方法。我很想知道-您在离群值方面有什么经验?您是否使用上述任何方法?
-Caitlin Garrett,统计分析师
https://conversionxl.com/blog/outliers/
One thing many people forget when dealing with data: outliers.
Even in a controlled online a/b test experiment, your dataset may be skewed by extremities. How do you deal with them? Trim them out, or is there some other way?
How do you even detect the presence of outliers and how extreme they are?
Especially if you’re optimizing your site for revenue, you should care about outliers. This post will dive into the nature of outliers in general, how to detect them, and then some popular methods for dealing with them.
许多人在处理数据时忘记的一件事:离群值。
即使在受控的在线a / b测试实验中,您的数据集也可能会被四肢扭曲。 您如何处理他们? 修剪掉它们,或者还有其他方法吗?
您甚至如何检测异常值的存在及其极端程度?
特别是如果您要优化网站的收入,则应注意离群值。 这篇文章将深入探讨异常值的性质,如何检测异常值,然后介绍一些处理异常值的流行方法。
What Are Outliers?
First, what exactly are outliers?
An outlier is an observation that lies an abnormal distance from other values in a random sample from a population.
首先,离群值到底是什么?
离群值是与总体中随机样本中的其他值存在异常距离的观察值。
There is, of course, a degree of ambiguity here. Qualifying a data point as an anomaly leaves it up to the analyst or model to determine what is actually abnormal and what to do with such data points.
There are also different degrees of outliers:
- Mild outliers lie beyond an inner fence on either side
- Extreme outliers are beyond an outer fence
Why do outliers occur? According to Tom Bodenberg, chief economist and data consultant at market research firm Unity Marketing, “It can be the result of measurement or recording errors, or the unintended and truthful outcome resulting from the set’s definition.”
Outliers could contain valuable information, they could be meaningless aberrations caused by measurement and recording errors, they could cause problems with repeatable A/B test results. So it’s important to question and analyze outliers in any case to see what their actual meaning is.
当然,这里存在一定程度的歧义。 将数据点定为异常将其留给分析人员或模型来确定实际异常的内容以及如何处理此类数据点。
也有不同程度的离群值:
温和的异常值位于两侧的内部围栏之外
极端离群值超出了外部范围
为什么发生异常值? 市场研究公司Unity Marketing的首席经济学家和数据顾问Tom Bodenberg表示:“这可能是测量或记录错误的结果,也可能是集合定义带来的意外和真实的结果。”
离群值可能包含有价值的信息,它们可能是由测量和记录错误引起的无意义的像差,它们可能导致可重复的A / B测试结果出现问题。 因此,无论如何都要质疑和分析离群值以了解其实际含义,这一点很重要。
Why are they occurring, where, and what might the meaning be? The answer could be different business to business, but it’s important to have the conversation rather than to ignore the data regardless of the significance.
The real question, though, is how do outliers affect your testing efforts?
它们为什么发生,在哪里发生,含义是什么? 答案可能因企业而异,但是重要的是进行对话而不是忽略数据,无论其重要性如何。
但是,真正的问题是,异常值如何影响您的测试工作?
How Outliers Affect A/B Testing
Though outliers will show up in many analysis situations, for the sake of conversion optimization, you should mostly be concern about tests where you’re optimizing for revenue metrics like Average Order Value or Revenue Per Visitor.
You can easily imagine anecdotally how outliers could affect a single A/B test result. If not, here’s Taylor Wilson, Senior Optimization Analyst at Brooks Bell, explaining a few scenarios in which that could happen:
离群值如何影响A / B测试
尽管在许多分析情况下都会出现异常值,但是出于转化优化的考虑,您应该主要关注要针对收入指标(例如平均订单价值或每位访客收入)进行优化的测试。
您可以轻松地想象离群值如何影响单个A / B测试结果。 如果没有,这里是Brooks Bell的高级优化分析师Taylor Wilson,解释了可能发生的几种情况:
 Taylor Wilson:
“In this particular situation, resellers were the culprit—customers who buy in bulk with the intention of reselling items later. Far from your typical customer, they place unusually large orders, paying little attention to the experience they’re in.
It’s not just resellers who won’t be truly affected by your tests. Depending on your industry, it could be very loyal customers, in-store employees who order off the site, or another group that exhibits out-of-the-ordinary behavior.”
Especially in data sets with low sample sizes, outliers can mess up your whole day.
“在这种特殊情况下,转售商是罪魁祸首。顾客大量购买商品是为了以后转售商品。 他们远离您的典型客户,他们下了非常大的订单,很少关注他们所经历的事情。
不仅仅是经销商不会真正受到您的测试的影响。 根据您所在行业的不同,可能是非常忠实的客户,在现场下订单的店内员工或其他表现出异常行为的团队。”
尤其是在样本量较小的数据集中,离群值可能会浪费您一整天的时间。
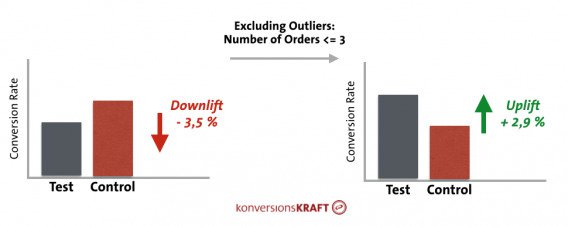
As Dr. Julia Engelmann, Head of Data Analytics at Konversionkraft, mentioned in a CXL blog post, “Almost every online shop has them and usually they cause problems for the valid evaluation of a test: the bulk orderers.”
So this isn’t a rare, fringe problem. She shared this specific example of how including and excluding outliers can affect the results of a test, and ultimately the decision you make:
正如Konversionkraft的数据分析主管Julia Engelmann博士在CXL博客文章中提到的那样:“几乎每个在线商店都拥有它们,通常它们会给测试的有效评估带来问题:批量订购者。”
因此,这不是一个罕见的边缘问题。 她分享了这个具体示例,其中包括和排除异常值如何影响测试结果以及最终影响您做出的决定:
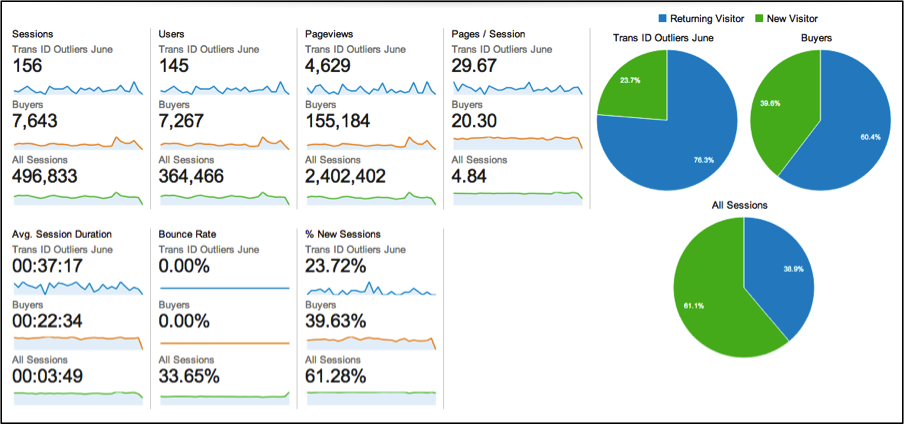
A problem outliers can cause in A/B tests, HiConversion noted, is that outliers tend not to be affected by the smaller UI changes that may affect a more fickle and mainstream population. Bulk orderers will push through your smaller usability changes like your average visitor may not.
Their article outlined a case where outliers skewed the results of a test. Upon further analysis, the outlier segment was 75% return visitors and much more engaged than the average visitor.
HiConversion指出,离群值可能会在A / B测试中引起问题,那就是离群值通常不会受到较小的UI更改的影响,而UI更改可能会影响更多善变的主流人群。 批量订购者将推动您进行较小的可用性更改,就像您的普通访问者可能不会这样做一样。
他们的文章概述了异常值使测试结果偏斜的情况。 经过进一步分析,离群部分的回访者为75%,并且比普通访问者的参与度高得多。
Think your data is immune to outliers? Maybe it is, but probably not – and in any case, it’s best to know for sure. So how do you diagnosis that on your own? That is to say, how do you detect outliers in your data?
认为您的数据不受异常值的影响? 也许是,但可能不是,无论如何,最好是一定要知道。 那么您如何自己诊断呢? 也就是说,如何检测数据中的异常值?
How to Detect Outliers in Data
Data visualization is a core discipline for analysts and optimizers, not just to better communicate results with executives, but to explore the data more fully.
As such, outliers are often detected through graphical means, though you can also do so by a variety of statistical methods using your favorite tool (Excel and R will be referenced heavily here, though SAS, Python, etc. all work).
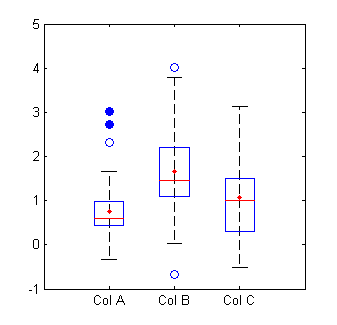
Two of the most common graphical ways of detecting outliers are the boxplot and the scatterplot. A boxplot is my favorite way.
You can see here that the blue circles are outliers, with the open circles representing mild outliers and closed circles representing extreme outliers:
数据可视化是分析人员和优化人员的核心学科,不仅是为了与执行人员更好地交流结果,而且是更充分地探索数据。
因此,离群值通常是通过图形方式检测的,尽管您也可以使用自己喜欢的工具通过多种统计方法进行检测(Excel和R在这里会被大量引用,尽管SAS,Python等都可以使用)。
检测异常值的两种最常见的图形方式是箱线图和散点图。 箱线图是我最喜欢的方式。
您可以在此处看到蓝色圆圈是离群值,空心圆圈代表温和离群值,实心圆圈代表极端离群值:
It’s really easy to analyze boxplots in R. Just use boxplot(x, horizontal = TRUE) where x is your data set to make something that looks like this:
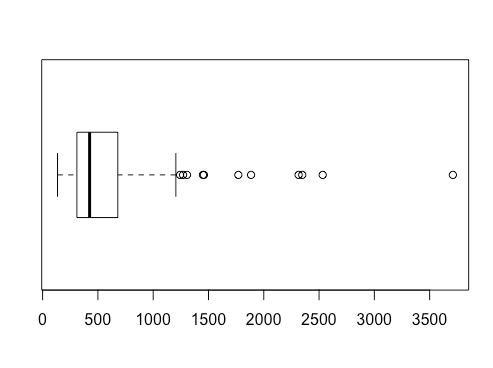
Even better, you can use boxplot.stats(x) function, where x is your data set, to get summary stats that includes the list of outliers ($out):

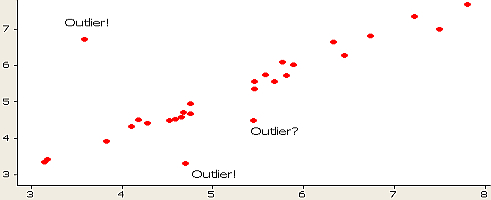
You can also see these in a scatterplot, though I believe it’s a bit harder to tell with clarity what extreme and mild outliers are:

A histogram can work as well:

You can also see outliers fairly easily in run charts, lag plots (a type of scatterplot), and line charts, depending on what type of data you’re working with.
Conversion expert Andrew Anderson also backs the value of graphs to determine the effect of outliers on data:
 Andrew Anderson:
“The graph is your friend. One of the reasons that I look for 7 days of consistent data is that it allows for normalization against non normal actions, be it size or external influence.
The other thing is that if there are obvious non-normal action values, it is ok to normalize them to the average as long as it is done unilaterally and is done to not bias results. This is only done if it is obviously out of normal line and usually I will still run the test another 2-3 extra days just to make sure.”
As to the latter point on non-normal distributions, we’ll go into that a bit later in the article.
But is there a statistical way of detecting outliers, apart from just eyeballing it on a chart? Indeed, there are many ways to do so (outlined here), the main two being a standard deviation approach or Tukey’s method.
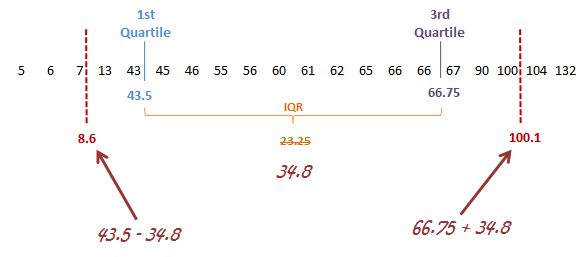 Image Source
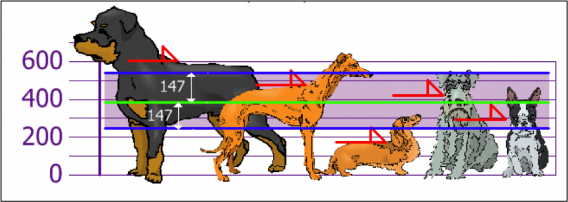
In the latter, extreme outliers tend to lie more than 3.0 times the interquartile range below the first quartile or above the third quartile, and mild outliers lie between 1.5 times and 3.0 times the interquartile range below the first quartile or above the third quartile.
It’s pretty easy to highlight outliers in Excel. While there’s no built-in function for outlier detection, you can find the quartile values and go from there. Here’s a quick guide if you’re interested in doing that.
Strategies for Dealing with Outliers in Data
Should an outlier be removed from analysis? The answer, though seemingly straightforward, isn’t so simple.
There are many strategies for dealing with outliers in data, and depending on the situation and data set, any could be the right or the wrong way. In addition, most major testing testing tools have strategies for dealing with outliers, but they usually differ in how exactly they do so.
Because of that, it’s still important to do your own custom analysis with regards to outliers, even if your testing tool has its own default parameters. Not only can you trust your testing data better, but sometimes analysis of outliers produces its own insights that will help with optimization.
So let’s go over some common strategies:
Set Up a Filter in Your Testing Tool
Even though this has a little cost, filtering out outliers is worth doing it because you can often discover significant effects that are simply “hidden” by outliers.
According to Himanshu Sharma at OptimizeSmart, if you are tracking revenue as a goal in your A/B testing tool, you should set up a code which filters out abnormally large orders from your test results.
He says that you should look at your past analytics data to secure an average web order, and to set up filters with that in mind. In his example, imagine you have that your website average order value in the last 3 months has been $150 – then any order which is above $200 can be considered as an outlier.
Then it’s all about writing a bit of code to stop the tool from passing that value. Here are some brief instructions on how to do that in Optimizely. The tl;dr is that you exclude values above a certain amount with code that looks something like this (for orders above $200):
if(priceInCents <20000){
window.optimizely = window.optimizely || [];
window.optimizely.push([‘trackEvent’,
‘orderComplete’, {‘revenue’: priceInCents}]);
Remove or Change Outliers During Post-Test Analysis
Kevin Hillstrom, President of Mine That Data, explained why he will sometimes adjust outliers in tests…
 Kevin Hillstrom:
“On average, what a customer spends is not normally distributed.
If you have an average order value of $100, most of your customers are spending $70, $80, $90, or $100, and you have a small number of customers spending $200, $300, $800, $1600, and one customer spending $29,000. If you have 29,000 people in the test panel, and one person spends $29,000, that’s $1 per person in the test.
That’s how much that one order skews things.”
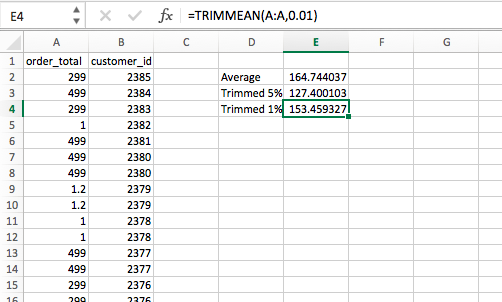
One way to account for this is simply to remove outliers, or trim your data set as to exclude as many as you’d like.
This is really easy to do in Excel – a simple TRIMMEAN function will do the trick. The first argument is the array you’d like to manipulate (column A here), and the second argument is by how much you’d like to trim the upper and lower extremities:
Trimming values in R is super easy, too. It exists within the mean(function). So, say you have a mean that differs quite a bit from the median, it probably means you have some very large or small values skewing it. In that case, you can trim off a certain percentage of the data on both the large and small side. In R, it’s just mean(x, trim = .05), where x is your data set and .05 can be any number of your choosing:

This process of using Trimmed Estimators is usually done to obtain a more robust statistic. By the way, the median is the most trimmed statistic, at 50% on both sides (which you can also do with the mean function in R – mean(x, trim = .5)).
Most of the time in optimization, your outliers will be on the higher end because of bulk orderers. Given your knowledge of historical data, if you’d like to do a post-hoc trimming of values above a certain parameter, that’s very easy to do in R. If the name of my data set is “rivers” I can do this, given the knowledge that my data usually falls under 1210: rivers.low <- rivers[rivers<1210].
That creates a new variable only consisting of what I deem to be non-outlier values, and from there I can boxplot it, getting something like this:

Clearly there are fewer outlier values, though there are still a few. This will virtually always happen, no matter how many values you trim from the extremes.
You can also do this by removing values that are beyond three standard deviations from the mean. To do that, first you need to extract the raw data from your testing tool. Optimizely reserves this ability for their enterprise customers unless you ask support to help you.
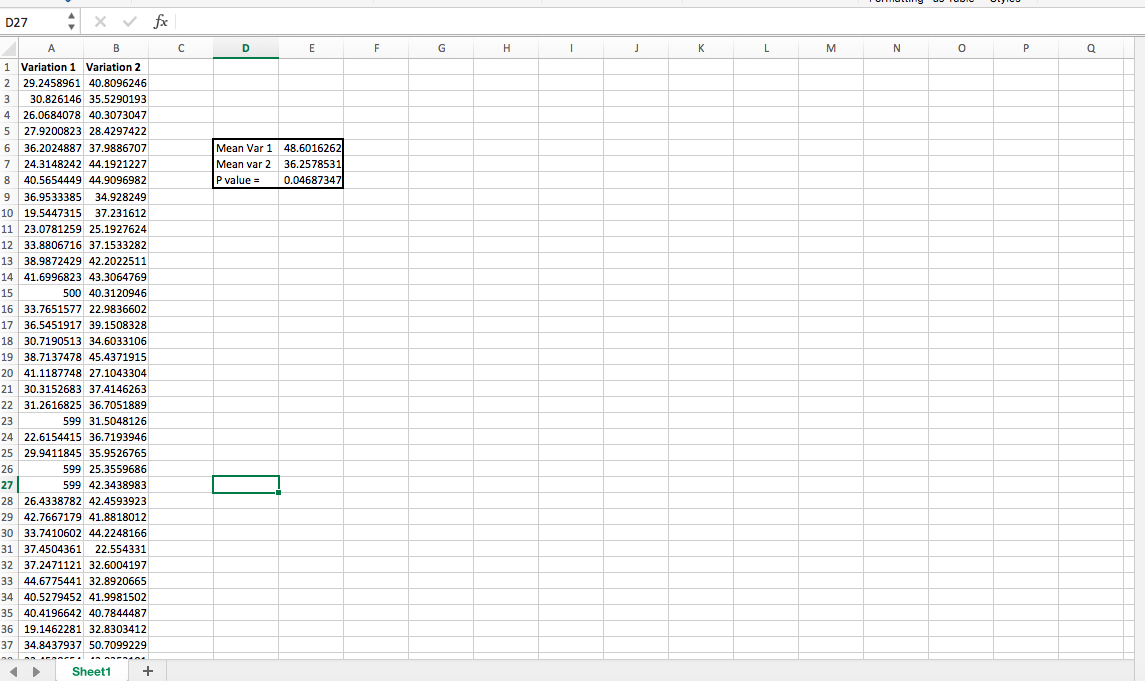
Instead of taking real client data, just to demonstrate how to do this, I generated two random sequence of numbers with normal distributions (using =NORMINV(RAND(),C1,D1) where C1 is mean and D1 is SD, for reference). In “variation 1,” though, I added a few very high outliers, making variation 1 a “statistically significant” winner:
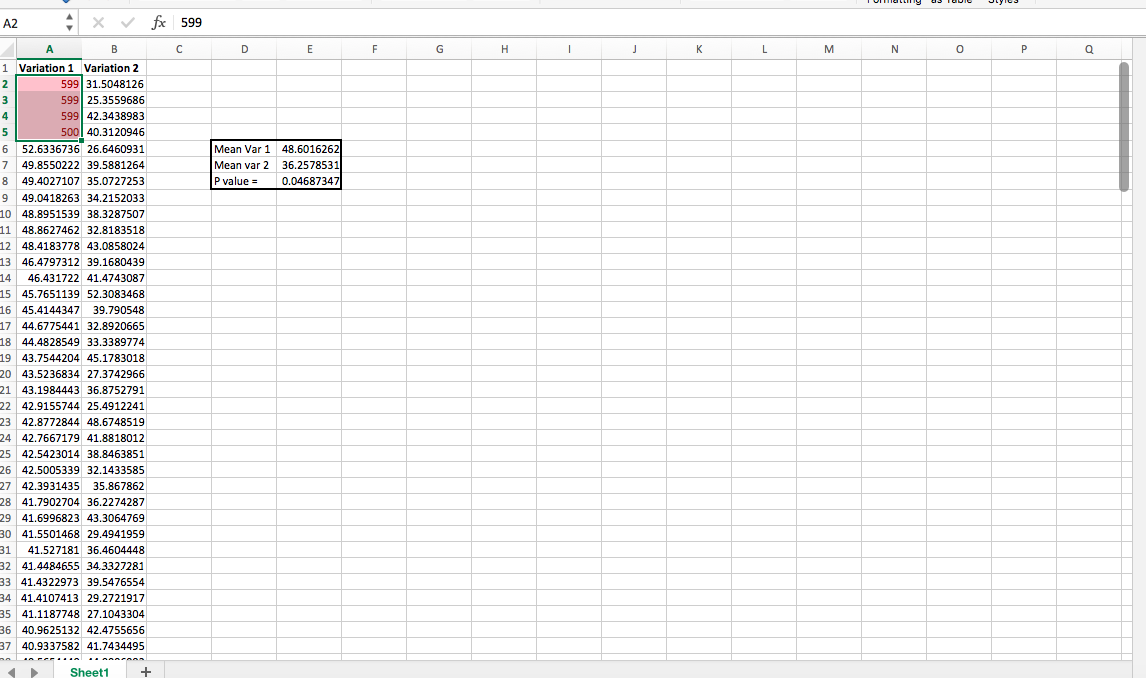
Then you can use conditional formatting to highlight those that are above 3 standard deviations. Chop those off:
And you have a different statistically significant winner:
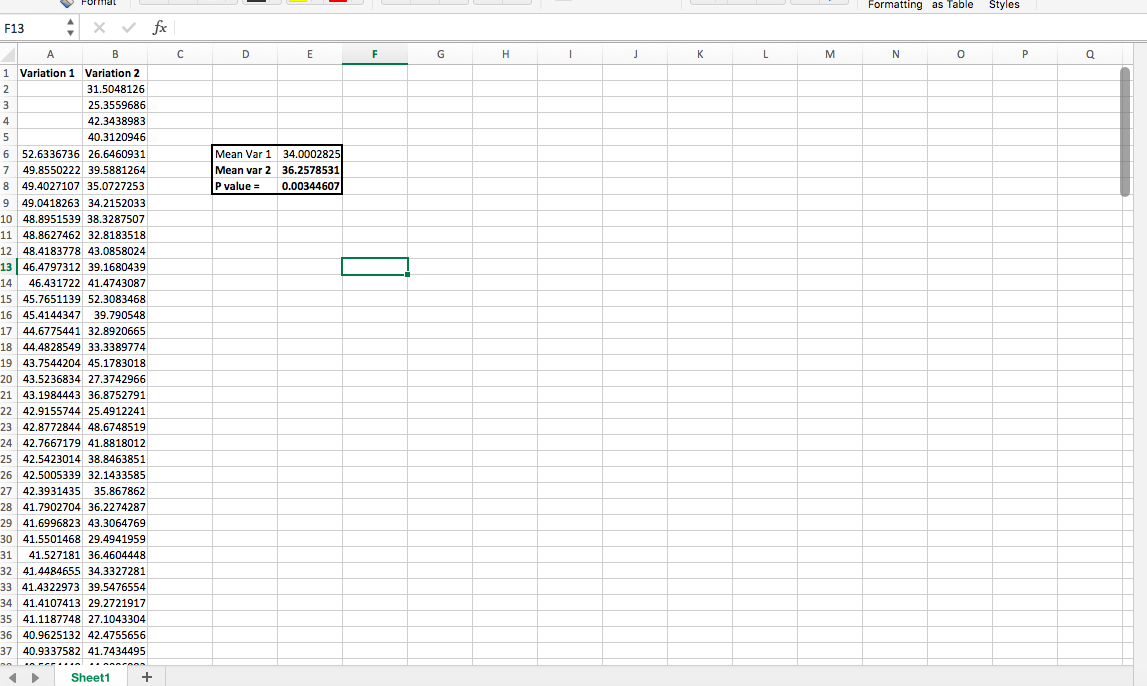
My example is incredibly clean cut and probably simpler than you’ll deal with, but at least you can see how just a few very high values can throw things off (and one possible solution to that). If you want to play around with outliers using this fake data, click here to download the spreadsheet.
Change the Value of Outliers
Much of the debate on how to deal with outliers in data comes down to the following questions: should you keep outliers, remove them, or change them to another variable?
Essentially, instead of simply removing the outliers from the data, in this case you take your set of outliers and change their values to something more representative of your data set. It’s a small distinction, but important: when you trim data, the extreme values are discarded. When you use winsorized estimators (changing the values), extreme values are instead replaced by certain percentiles (the trimmed minimum and maximum).
Kevin Hillstrom mentioned in his podcast that he trims the top 5% or top 1% (depending on the business) of orders and changes the value (e.g. $29,000 to $800). As he says, “You are allowed to adjust outliers.”
Consider the Underlying Distribution
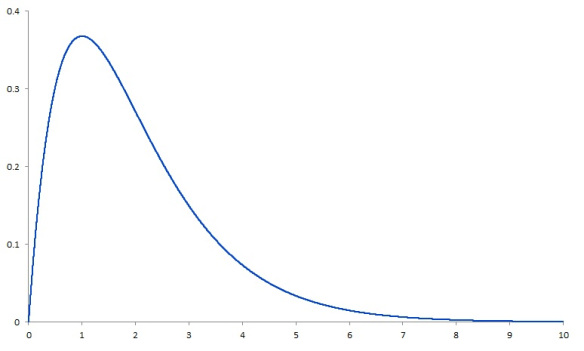
Traditional methods to calculate confidence intervals assume that the data follows a normal distribution, but as we discussed above, with certain metrics like average revenue per visitor, that usually isn’t the way reality works.
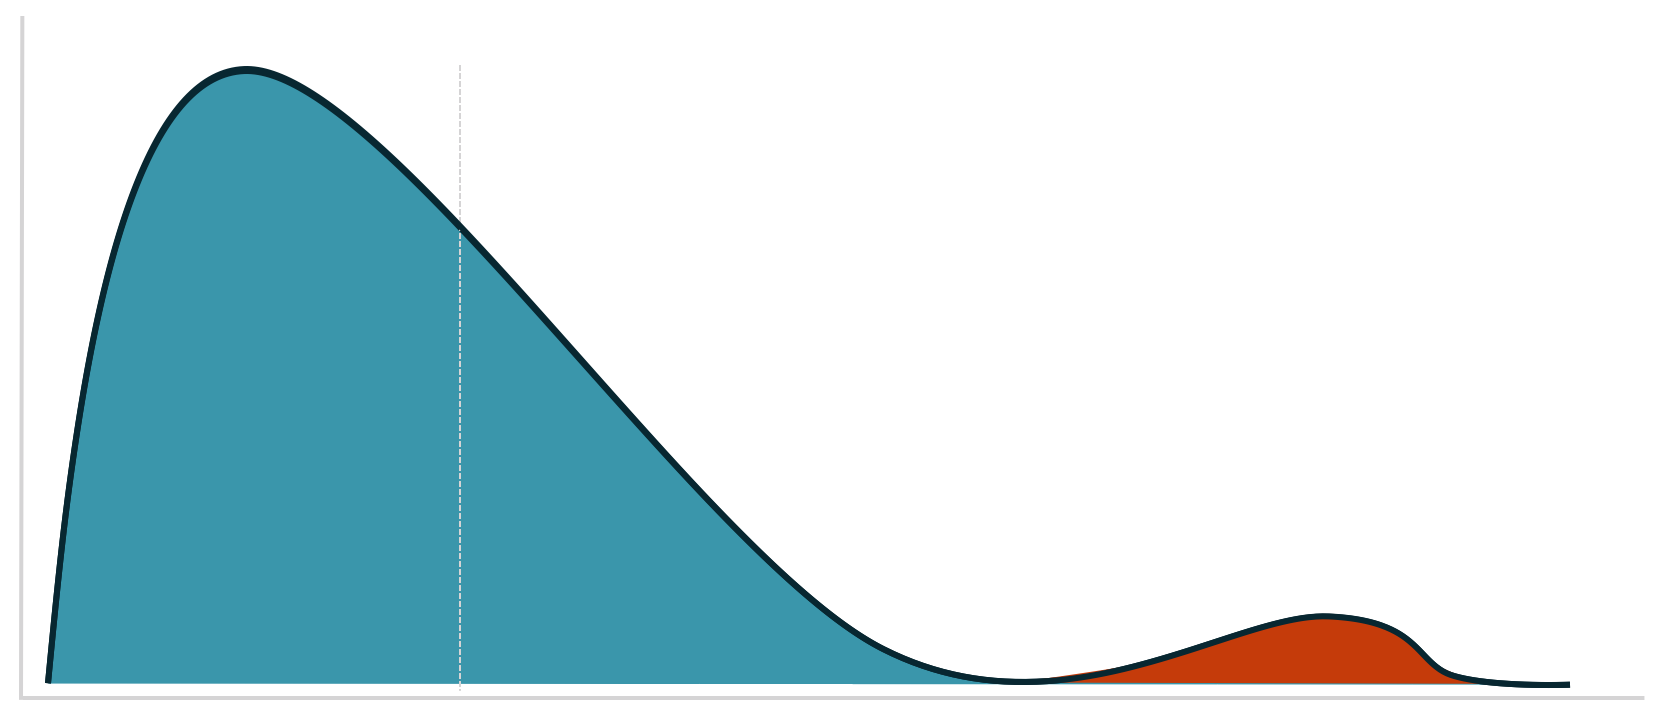
In another section of Dr. Julia Engelmann’s wonderful article for our blog, she shared a graphic depicting this difference. The left graphic shows a perfect (theoretical) normal distribution. The number of orders fluctuates around a positive average value. In the example, most customers order five times. More or fewer orders arise less often.
The graphic to the right shows the bitter reality. Assuming an average conversion rate of 5%, 95% are customers who don’t buy. Most buyers have probably placed one or two orders, and there are a few customers who order an extreme quantity.

The distribution on the right side is known as a “right-skewed” distribution.
Essentially, the problem comes in when we assume that a distribution is normal but we’re actually working with something like a right skewed distribution. Confidence intervals can no longer be reliably calculated.
With your average ecommerce site, let’s say at least 90% of customers will not buy anything. Therefore, the proportion of “zeros” in the data is extreme and the deviations in general are enormous, including extremities because of bulk orders.
In this case, it’s worth taking a look at the data using other methods than the t-test. (The Shapiro-Wilk test lets you test your data for normal distribution, by the way). All of these were suggested in this article:
1. Mann-Whitney U-Test
The Mann-Whitney U-Test is an alternative to the t-test when the data deviates greatly from the normal distribution.
2. Robust statistics
Methods from robust statistics are used when the data is not normally distributed or distorted by outliers. Here, average values and variances are calculated such that they are not influenced by unusually high or low values – which I sort of went into with windsorization above.
3. Bootstrapping
This so-called non-parametric procedure works independently of any distribution assumption and provides reliable estimates for confidence levels and intervals. At its core, it belongs to the resampling methods. They provide reliable estimates of the distribution of variables on the basis of the observed data through random sampling procedures.
Consider the Value of Mild Outliers
As mentioned, with Revenue Per Visitor the underlying distribution is often non-normal. It’s common for few big buyers to skew the data set towards the extremes. When this is the case, outlier detection falls prey to predictable inaccuracies – it detects outliers far more often.
So there’s a chance that in your data analysis, you shouldn’t throw away outliers. Rather, you should segment them and analyze them deeper. What demographic, behavioral, firmographic traits correlate with their purchasing behavior and how can you run an experiment to tease out some causality there?
This is a question that runs deeper than simple A/B testing and is core to your customer acquisition, targeting, and segmentation efforts. I don’t want to go too deep here, but I want to say that for various marketing reasons, analyzing your highest value cohorts can bring profound insights as well.
No Matter What, Do Something
In any case, it helps to have a plan in place. As Dan Begley-Groth wrote on the Richrelevance blog:
 Dan Begley-Groth:
“In order for a test to be statistically valid, all rules of the testing game should be determined before the test begins. Otherwise, we potentially expose ourselves to a whirlpool of subjectivity mid-test.
Should a $500 order only count if it was directly driven by attributable recommendations? Should all $500+ orders count if there are an equal number on both sides? What if a side is still losing after including its $500+ orders? Can they be included then?
By defining outlier thresholds prior to the test (for RichRelevance tests, three standard deviations from the mean) and establishing a methodology that removes them, both the random noise and subjectivity of A/B test interpretation is significantly reduced. This is key to minimizing headaches while managing A/B tests”
Whether you believe outliers don’t have a strong effect on your data and choose to leave them as is, or whether you want to trim the top and bottom 25% of your data, the important thing is that you’ve thought it through and have an active strategy. Being data-driven means considering anomalies like this, and to ignore them means you could be making decisions on faulty data.
Conclusion
Outliers are something not discussed often in testing, but depending on your business and what metric you’re optimizing, they could certainly be affecting your results.
As we’ve seen, one or two high values in a smaller sample size can totally skew a test, leading you to make a decision off of faulty data. No bueno.
For the most part, if your data is affected by these extreme cases, you can bound the input to a historical representative of your data that excludes outliers. So that could be a number of items (>3) or a lower or upper bounds on your order value.
Another way, perhaps better in the long run, would be to export your post-test data and visualize it by various means. Determine on a case-by-case basis what the effect of the outliers was. And from there, decide whether you want to remove, change, or keep the outlier values.
Really, though, there are lots of ways to deal with outliers in data. It’s not a simple quick fix that works across the board, and that’s why the demand for good analysts continues to grow.
