我目前所在公司开发团队比较小,为集团下面的工厂开发了一套小的系统,跑在一台CentOS服务器上,服务器搭建了docker环境,安装了docker-compose,但在日志处理方面,暂时没有一个好的方法能够收集完全的日志,只能依赖进入至服务器后,以docker logs containerID的方法来进入查看,非常不方便,之前也有关注ELK的技术,但一直在开发系统功能,全力实现,今天得空,重新想起了ELK查看日志的任务。
kibana文档:https://www.elastic.co/guide/cn/kibana/current/index.html
关于elastic开始视频:https://www.elastic.co/guide/cn/index.html
项目文件夹
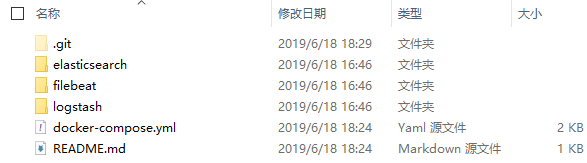
其中docker-compose.yml
version: '3'

services:
  filebeat:
    hostname: filebeat
    image: weschen/filebeat
    build:
      context: filebeat
      dockerfile: Dockerfile
    volumes:
      # needed to access all docker logs (read only) :
     - "/var/lib/docker/containers:/usr/share/dockerlogs/data:ro"
      # needed to access additional informations about containers
     - "/var/run/docker.sock:/var/run/docker.sock"
    links:
       - logstash
  kibana:
    image: docker.elastic.co/kibana/kibana:6.5.2
    environment:
      - "LOGGING_QUIET=true"
    links:
      - elasticsearch
    ports:
      - 5601:5601
  logstash:
    hostname: logstash
    image: weschen/logstash
    build:
      context: logstash
      dockerfile: Dockerfile
    ports:
      - 5044:5044
    environment:
      LOG_LEVEL: error
    links:
      - elasticsearch
  elasticsearch:
    hostname: elasticsearch
    image: weschen/elasticsearch
    build:
      context: elasticsearch
      dockerfile: Dockerfile
    environment:
      - cluster.name=docker-elk-cluster
      - bootstrap.memory_lock=true
      - "ES_JAVA_OPTS=-Xms256m -Xmx256m"
    ulimits:
      memlock:
        soft: -1
        hard: -1
    ports:
      - 9200:9200
1.Elasticsearch
文件elasticsearch/Dockerfile
FROM docker.elastic.co/elasticsearch/elasticsearch:6.5.2
COPY --chown=elasticsearch:elasticsearch elasticsearch.yml /usr/share/elasticsearch/config/

CMD ["elasticsearch", "-Elogger.level=INFO"]
文件elasticsearch/elasticsearch.yml
cluster.name: ${cluster.name}
network.host: 0.0.0.0

# minimum_master_nodes need to be explicitly set when bound on a public IP
# set to 1 to allow single node clusters
# Details: https://github.com/elastic/elasticsearch/pull/17288
discovery.zen.minimum_master_nodes: 1
2.Logstash
文件logstash/Dockerfile
FROM docker.elastic.co/logstash/logstash:6.5.2

RUN rm -f /usr/share/logstash/pipeline/logstash.conf
COPY pipeline /usr/share/logstash/pipeline/
文件logstash/pipeline/logstash.conf
input {
    beats {
        port => 5044
        host => "0.0.0.0"
      }
}

output {
    elasticsearch {
        hosts => elasticsearch
        manage_template => false
        index => "%{[@metadata][beat]}-%{[@metadata][version]}-%{+YYYY.MM.dd}"
    }

    stdout { codec => rubydebug }
}
3.Filebeat
文件filebeat/Dockerfile
FROM docker.elastic.co/beats/filebeat:6.5.2

# Copy our custom configuration file
COPY filebeat.yml /usr/share/filebeat/filebeat.yml

USER root
# Create a directory to map volume with all docker log files
RUN mkdir /usr/share/filebeat/dockerlogs
RUN chown -R root /usr/share/filebeat/
RUN chmod -R go-w /usr/share/filebeat/
文件filebeat/filebeat.yml
filebeat.inputs:
- type: docker
  combine_partial: true
  containers:
    path: "/usr/share/dockerlogs/data"
    stream: "stdout"
    ids:
      - "*"
  exclude_files: ['.gz$']
  ignore_older: 10m

processors:
  # decode the log field (sub JSON document) if JSON encoded, then maps it's fields to elasticsearch fields
- decode_json_fields:
    fields: ["log", "message"]
    target: ""
    # overwrite existing target elasticsearch fields while decoding json fields
    overwrite_keys: true
- add_docker_metadata:
    host: "unix:///var/run/docker.sock"

filebeat.config.modules:
  path: ${path.config}/modules.d/*.yml
  reload.enabled: false

# setup filebeat to send output to logstash
output.logstash:
  hosts: ["logstash"]

# Write Filebeat own logs only to file to avoid catching them with itself in docker log files
logging.level: error
logging.to_files: false
logging.to_syslog: false
loggins.metrice.enabled: false
logging.files:
  path: /var/log/filebeat
  name: filebeat
  keepfiles: 7
  permissions: 0644
ssl.verification_mode: none
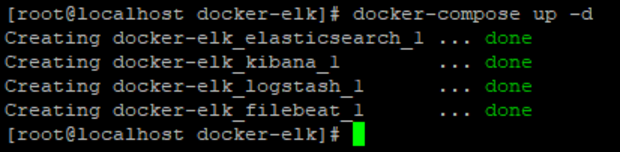
使用docker-compose up -d跑起来
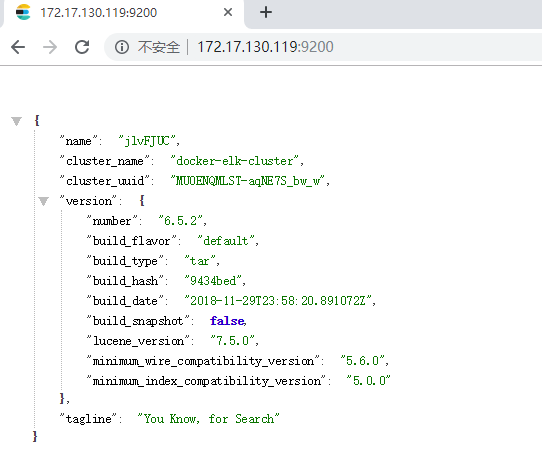
在浏览器打开[Host-IP]:9200,能够打开以下界面,说明elasticsearch服务已经起来了
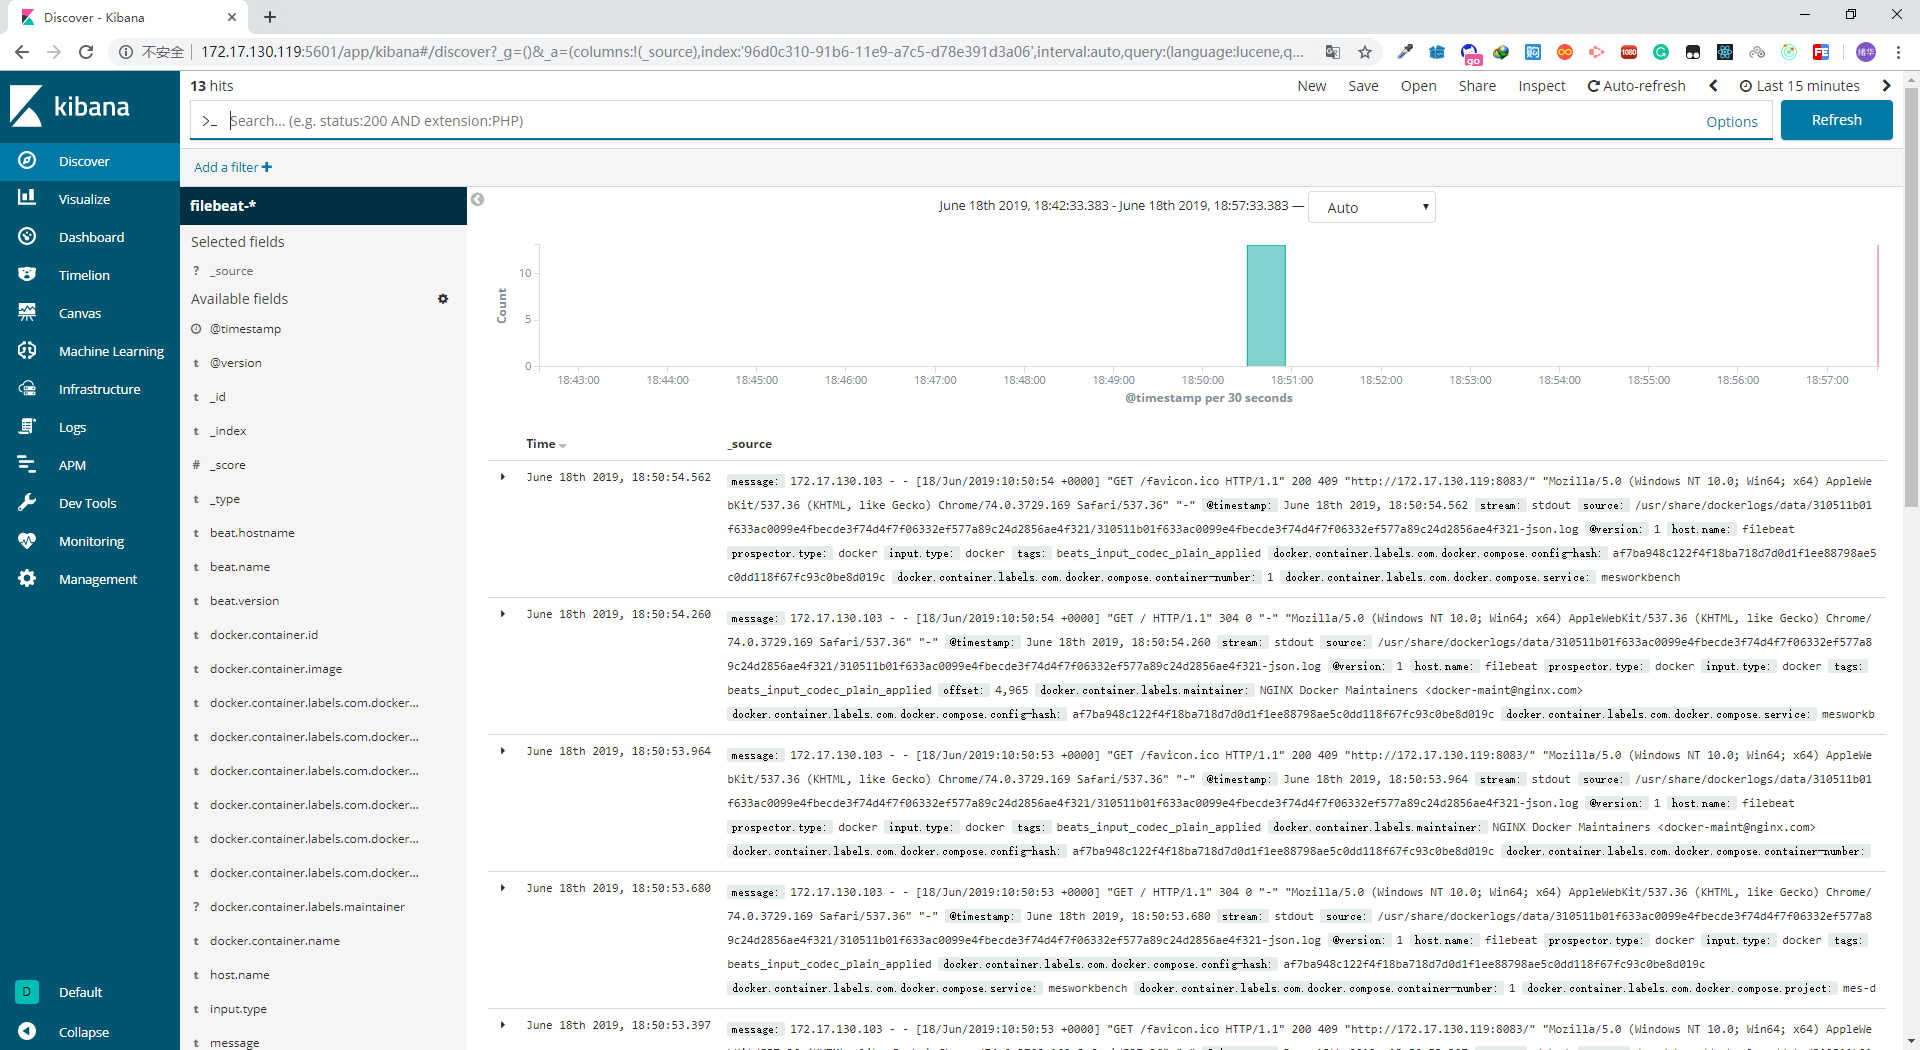
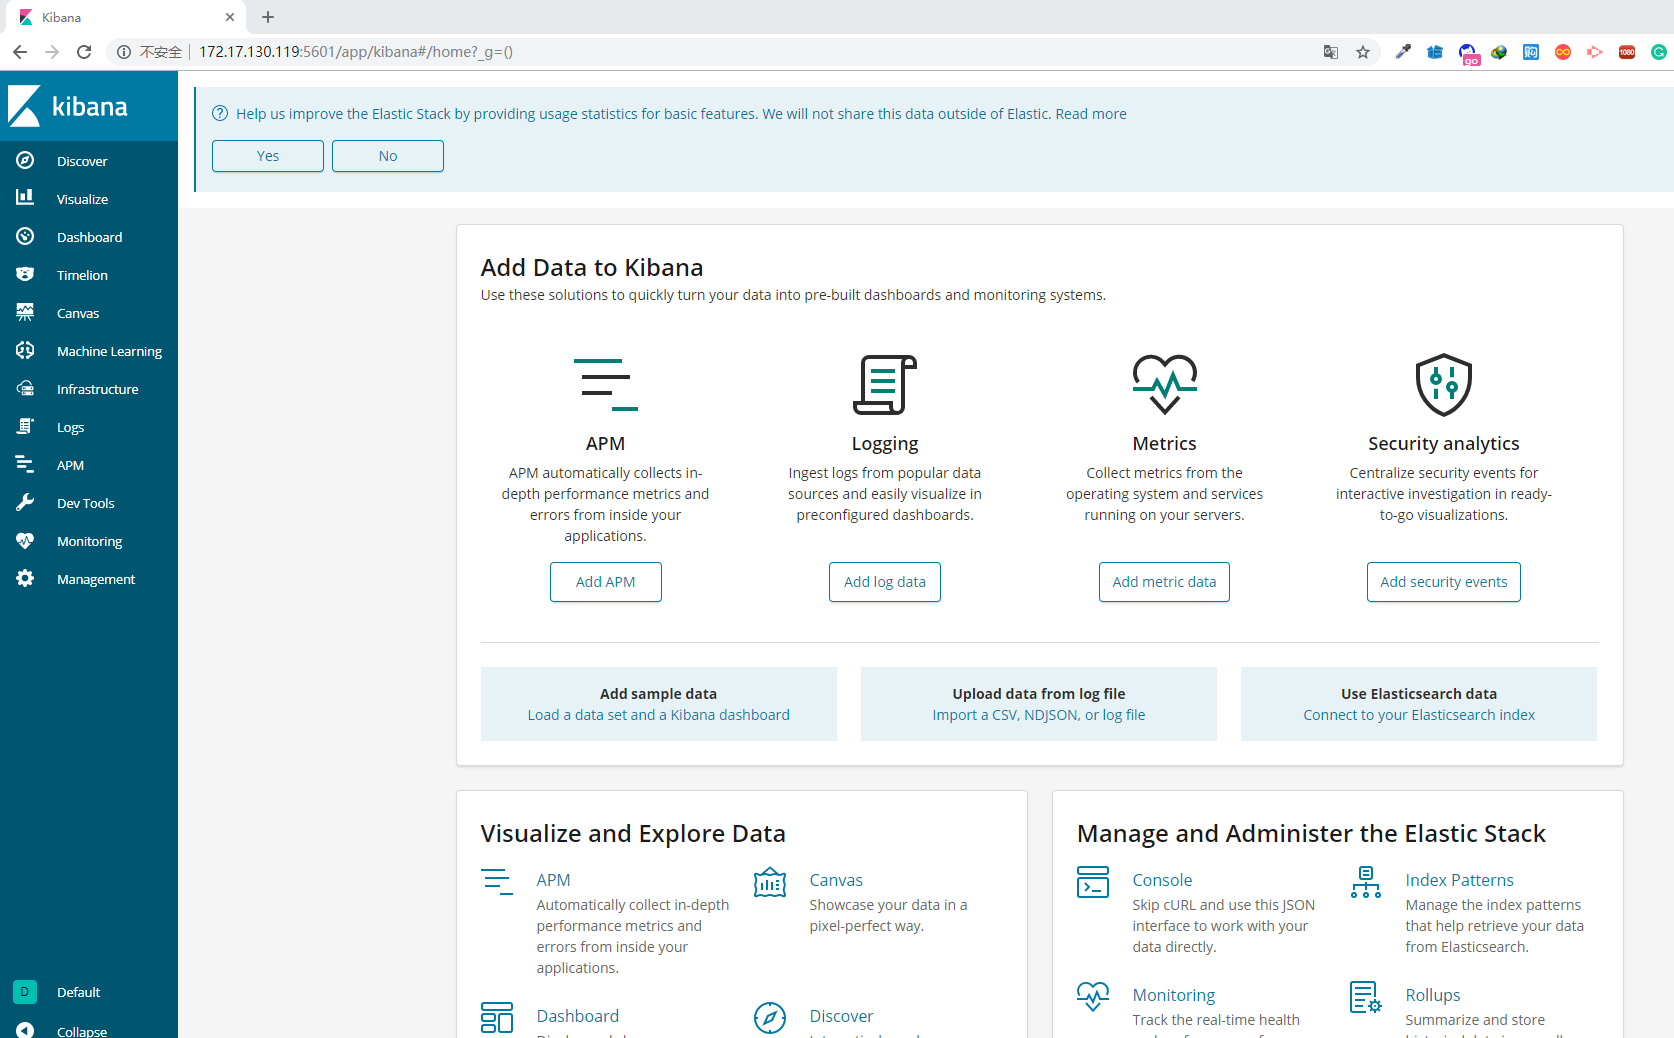
再在浏览器打开[Host-IP]:5601,是Kibana日志查看平台
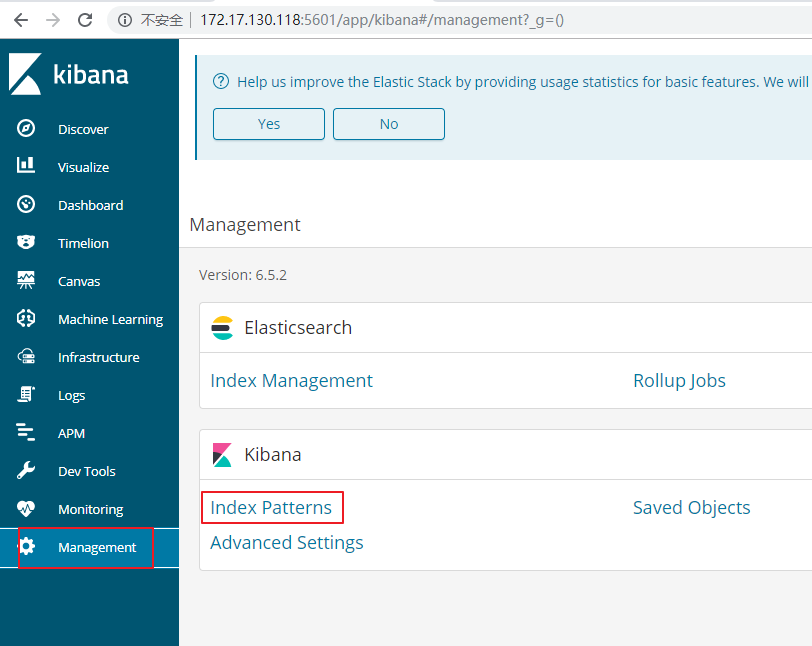
进入至系统菜单【管理】中的【index-pattern】
首次使用Kibana需要先创建index-pattern,创建index-pattern操作如下,如果在Discover菜单中创建index-pattern时,会出现以下
创建了index-pattern后,查看Logs应该可以查看到日志
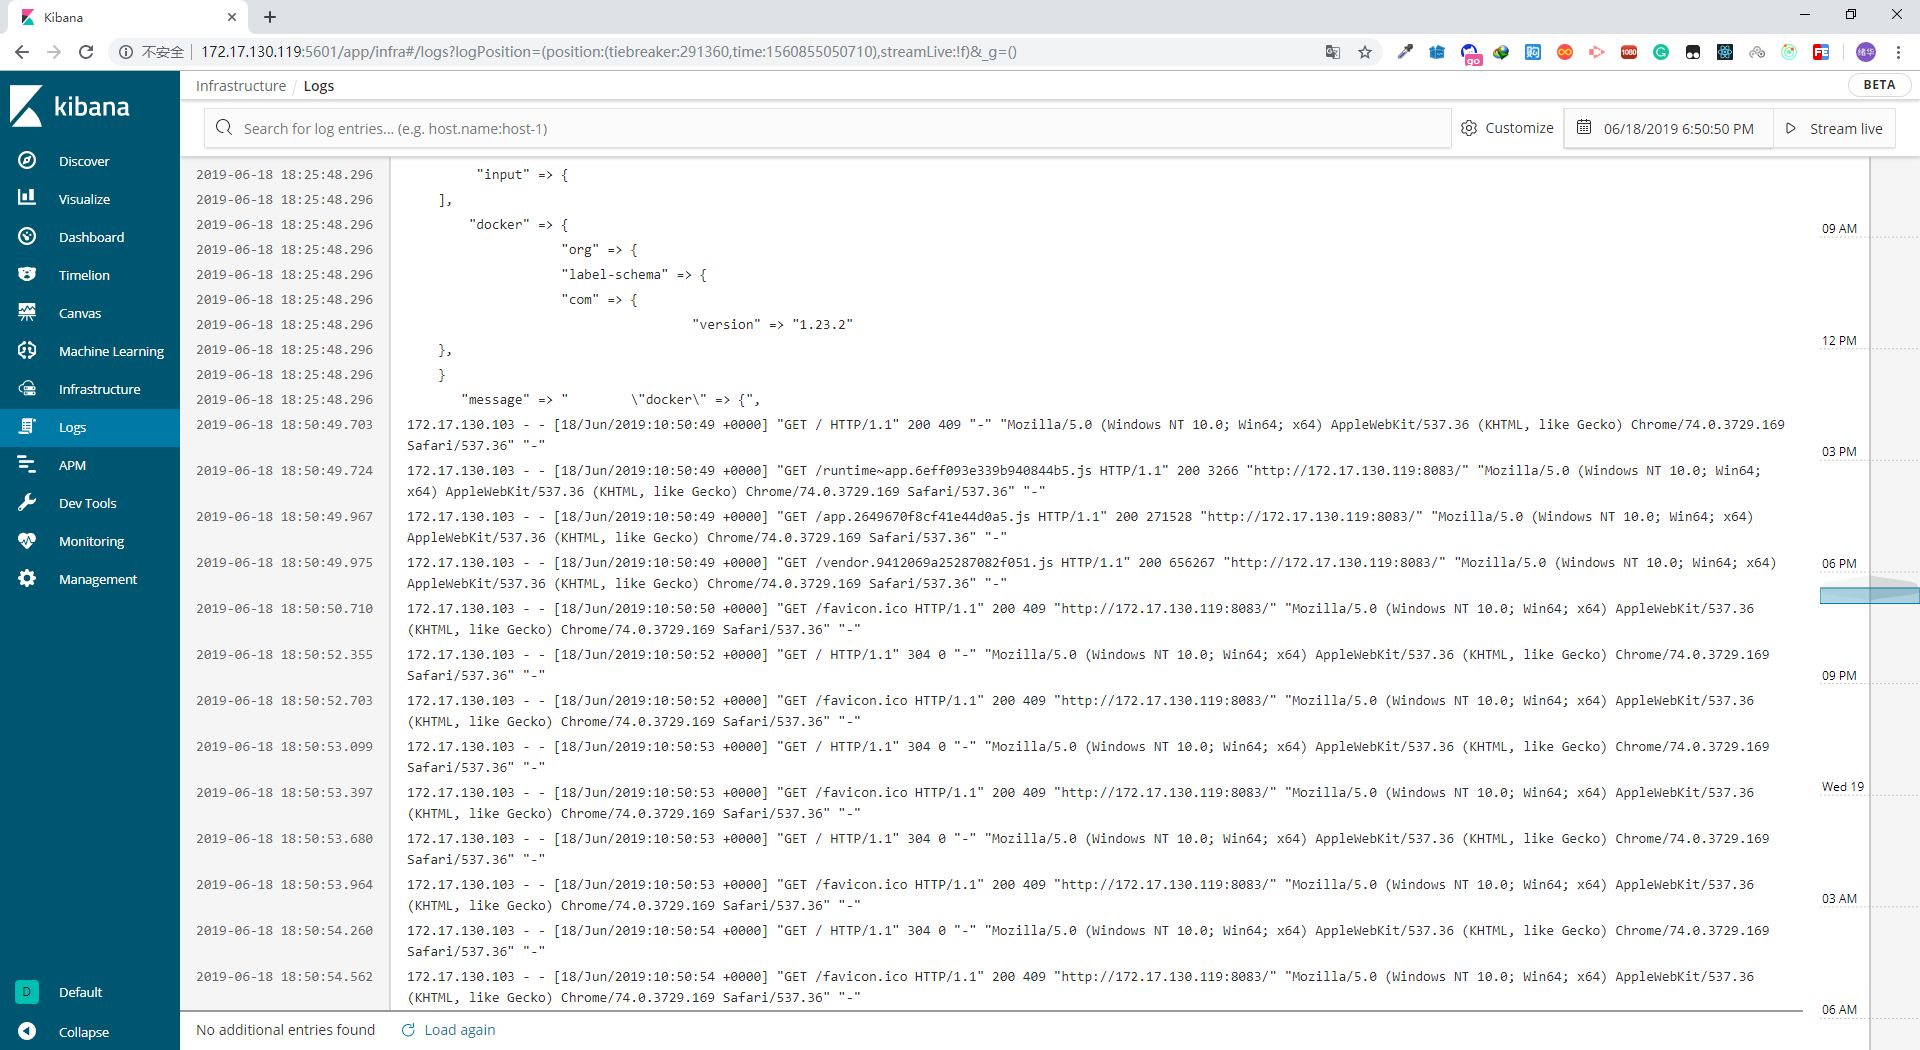
首页查看日志