Callgrind介绍
- 用来对统计程序的函数调用之间的关系, 并统计每个函数的耗时
- Callgrind之所以能够发现函数调用的关系, 依赖于平台的明确返回和调用指令. 在x86和amd64平台上works best, 但在PowerPC ARM Thumb以及MIPS上无法运行
- 可以使用gprof2dot来把profile结果生成图片
- SOF上一个关于C++ profile的很好的问题
对整个程序进行profile
- 先执行
valgrind --tool=callgrind ./prog_name, 跑完之后会生成一个callgrind.out.X的profile文件, X为线程号 - 使用KCachegrind分析结果文件:
kcachegrind callgrind.out.X. KCachegrind文档
只对程序某个片段进行profile
使用上面的方式的一大缺点就是会对整个程序都进行profile, 这样会导致过程很慢. 如果我们只想对程序的某个部分进行profile, 那么可以如下使用:
- 在一个shell中输入命令
valgrind --tool=callgrind --dump-instr=yes -v --instr-atstart=no ./prog_name > log.txt, 其中,--dump-instr=yes表示生成汇编指令注释,--instr-atstart=no表示不是程序启动时就启动profile, 方便控制节点. - 当程序运行到我们想要profile的片段时, 在另一个shell中输入
callgrind_control -i on - 当想要profile部分结束之后, 输入
callgrind_control -k - 使用KCachegrind分析Callgrind.out文件
更先进做法
上面的做法也就只能大概控制profile片段, 实操性不强. 根据文档说明, 可以使用指令来控制具体的Callgrind进行profile起止时间:
#include <valgrind/callgrind.h>

//codes...

//request callgrind to start full profile
CALLGRIND_START_INSTRUMENTATION;

//codes...

//request callgrind to stop full profile
CALLGRIND_STOP_INSTRUMENTATION;
callgrind.h头文件见这里. 上面的两个请求命令其实是在头文件里面定义两个宏.
/* Start full callgrind instrumentation if not already switched on.
   When cache simulation is done, it will flush the simulated cache;
   this will lead to an artifical cache warmup phase afterwards with
   cache misses which would not have happened in reality. */
#define CALLGRIND_START_INSTRUMENTATION
  VALGRIND_DO_CLIENT_REQUEST_STMT(VG_USERREQ__START_INSTRUMENTATION,
                                  0, 0, 0, 0, 0)

/* Stop full callgrind instrumentation if not already switched off.
   This flushes Valgrinds translation cache, and does no additional
   instrumentation afterwards, which effectivly will run at the same
   speed as the "none" tool (ie. at minimal slowdown).
   Use this to bypass Callgrind aggregation for uninteresting code parts.
   To start Callgrind in this mode to ignore the setup phase, use
   the option "--instr-atstart=no". */
#define CALLGRIND_STOP_INSTRUMENTATION
  VALGRIND_DO_CLIENT_REQUEST_STMT(VG_USERREQ__STOP_INSTRUMENTATION,
                                  0, 0, 0, 0, 0)
在一次程序运行中dump多次
使用命令CALLGRIND_DUMP_STATS;可以让Callgrind立即生成一个dump. 每次遇到这个命令都会生成一个dump, 即使在比如for循环里面, 那么就会生成循环次数相等的dump. 注意,对于CALLGRIND_START_INSTRUMENTATION和CALLGRIND_STOP_INSTRUMENTATION这对组合控制的是让Callgrind只统计命令区间内的代码, 即使这对组合放在比如for循环中, 如果没有CALLGRIND_DUMP_STATS;, 那么也只会生成一个dump.
使用CALLGRIND_ZERO_STATS;可以清除Callgrind当前的数据状态.
使用KCachegrind打开的profile dump界面:
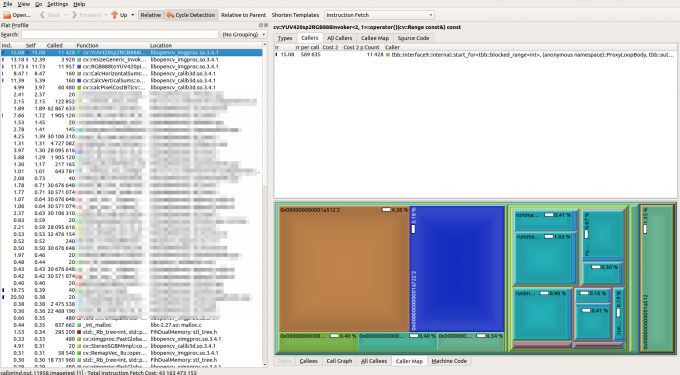
通过按Sl排列, 就可以很容易的看出哪个函数耗时占比最大, 从而针对性的优化
