使用 matplotlib 绘制带日期的坐标轴
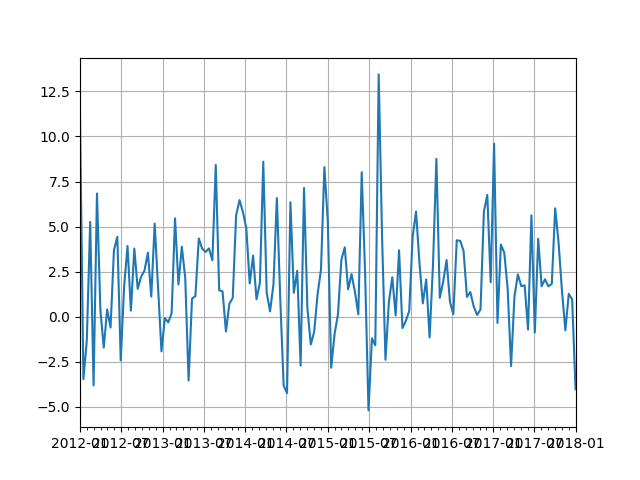
效果图

代码
import numpy as np
import matplotlib.pyplot as plt
import matplotlib.dates as mdates

fig, ax = plt.subplots()

"""生成数据"""
beginDate = '2012-01-01'
endDate = '2018-01-01'

# 将日期字符串转化为数字(从1970-01-01算起的天数差)
x = np.arange(mdates.datestr2num(beginDate), mdates.datestr2num(endDate), 15)
y = np.random.randn(len(x))*3+2

data = {}
# 将数字(天数差)转为日期对象 numpy.datetime64
data['date'] = [np.datetime64(int(c), 'D') for c in x]
data['value'] = y
ax.plot('date', 'value', data=data)
# ax.plot(data['date'], data['value']) # 与前一行是等效的


"""设置坐标轴的格式"""
# 设置主刻度, 每6个月一个刻度
fmt_half_year = mdates.MonthLocator(interval=6)
ax.xaxis.set_major_locator(fmt_half_year)

# 设置次刻度,每个月一个刻度
fmt_month = mdates.MonthLocator() # 默认即可
ax.xaxis.set_minor_locator(fmt_month)

# 设置 x 坐标轴的刻度格式
ax.xaxis.set_major_formatter(mdates.DateFormatter("%Y-%m"))

# 设置横坐标轴的范围
datemin = np.datetime64(data['date'][0], 'Y')
datemax = np.datetime64(data['date'][-1], 'Y') + np.timedelta64(1, 'Y')
ax.set_xlim(datemin, datemax)

# 设置刻度的显示格式
ax.format_xdata = mdates.DateFormatter('%Y-%m')
ax.format_ydata = lambda x : f'$x:.2f$'
ax.grid(True)

"""自动调整刻度字符串"""
# 自动调整 x 轴的刻度字符串(旋转)使得每个字符串有足够的空间而不重叠
fig.autofmt_xdate()

plt.show()
代码中使用到的类简单介绍一下,具体参数或用法可以点击查看。
- matplotlib.dates.datestr2num() 将日期转化为天数差
- numpy.datetime64() 将数字(天数差)转为日期对象
numpy.datetime64 - matplotlib.dates.MonthLocator() 配合设置日期刻度间隔
- matplotlib.dates.DateFormatter() 设置日期显示格式
- fig.autofmt_xdate() 自动调整坐标轴,未调用字符串会重叠在一起