二、虚机(服务器)方式
prometheus在虚机(服务器)中安装运行。
命令行启动
在安装完成以后,可以直接在命令行启动。启动方式通常是:
./prometheus --config.file=prometheus.yml &
或者
nohup /opt/prometheus/prometheus &
如果要使用不同于9090的端口号,可以在命令行参数 --web.listen-address中指定,如:
./prometheus --config.file=prometheus.yml --web.listen-address=:8091 &
启动以后,访问http://xxx.xxx.xxx.xxx:8091,可以看到,端口确实更改了。
顺便说一下,要看prometheus的所有命令行参数,可以执行如下命令:
./prometheus -h
服务方式启动
安装完成以后,也可以把prometheus配置成自启动的服务,在其中的配置文件中也可以自定义prometheus的启动端口。步骤如下:
1. 在 /etc/systemd/system目录下创建新文件 prometheus.service,其中ExecStart字段指定启动参数时,设置自定义端口,内容如下:
--web.listen-address=:8091
[Unit]
Description=Prometheus Monitoring System
Documentation=Prometheus Monitoring System
[Service]
ExecStart=/opt/proe/prometheus-2.3.1.linux-amd64/prometheus
--config.file=/opt/proe/prometheus-2.3.1.linux-amd64/prometheus.yml --web.enable-admin-api
--web.listen-address=:8091
[Install]
WantedBy=multi-user.target
2.执行命令:
systemctl start prometheus.service
如果prometheus在运行,有时候要执行如下命令:
systemctl daemon-reload
3.验证prometheus是否在新端口正常启动:
输入如下命令:
netstat -lntp | grep prometheus
[root@k8s-node-3 system]# netstat -lntp |grep prometheus
tcp6 0 0 :::8091 :::* LISTEN 11758/prometheus
可见端口已经是自定义的端口了。
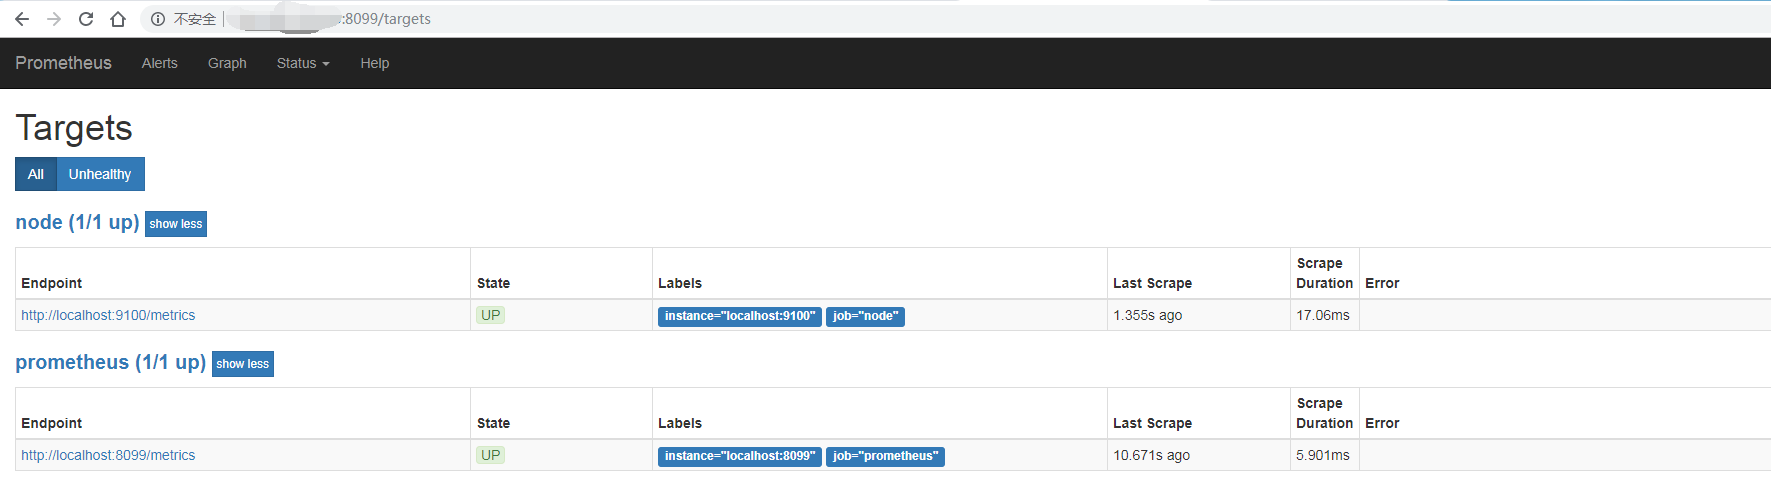
访问:http://localhost:8099
参考文章:https://blog.csdn.net/palet/article/details/82988100
Grafana安装
下载安装
官网下载地址:https://grafana.com/grafana/download?platform=linux
wget https://dl.grafana.com/oss/release/grafana-6.2.5-1.x86_64.rpm
sudo yum localinstall grafana-6.2.5-1.x86_64.rpm

默认安装路径
# Home=/usr/share/grafana
# Data=/var/lib/grafana
# Logs=/var/log/grafana
# Plugins=/var/lib/grafana/plugins
# Provisioning=/etc/grafana/provisioning
# PidFile=/var/run/grafana/grafana-server.pid
# Config=/etc/grafana/grafana.ini
# DefualtConfig=/usr/share/grafana/conf/defaults.ini
添加到服务并自启动
/sbin/chkconfig --add grafana-server
systemctl enable grafana-server.service
启动服务
service grafana-server start
安装 zabbix 插件
grafana-cli plugins install alexanderzobnin-zabbix-app
查看安装
rpm -qa | grep grafana
find / -name grafana
清除(卸载)
rpm -e grafana-5.3.2-1.x86_64
find / -name grafana -exec rm -rf {} ;
修改密码:
执行grafana-cli admin reset-admin-password yourpassword
则admin账号密码被重置为yourpassword
参考资料:https://blog.csdn.net/kk185800961/article/details/83515382